|
|
Post by ms on Jun 8, 2023 9:30:03 GMT -5
Antigua, I think Q should be measured at a higher frequency, such as three KHz, because this is in the range of frequencies that one hears as most affecting the brightness of the sound, and so the Q near that frequency is a good indication of the brightness that the pickup can produce.
|
|
|
|
Post by ms on Jun 8, 2023 9:25:27 GMT -5
I am not seeing your plot. (Edit: OK plot appeared.)
The purpose of the 100 ohm reisistor is to make the current nearly constant with frequency. It would be best to verify that this is the case with a measurement.
|
|
|
|
Post by ms on Jun 7, 2023 20:23:01 GMT -5
He does not mean electromagnetic (that is radio waves, for example), just electric. For example, touch the tip on a guitar cable plugged into an amp. Your body is at a different electric potential than the low side of the connector in the amp.
I do not see how a humbucker can cancel electric fields, only magnetic.
An electric shield does not have to be a very good conductor in order to do a very good job of shielding at audio frequencies. The rate at which charge can be redistributed is a function of the capacitance involved and the conductivity of the shield, and thus the charge redistribution can be limited at very high frequencies, but not low.
|
|
|
|
Post by ms on Jun 5, 2023 7:34:52 GMT -5
I think there are two kinds of measurements that are necessary:
1. Impedance versus frequency. You can make a device to do this that does not significantly affect the measurement. (It takes a resistor and a recording interface.)
2. Frequency response using an exciter coil. I prefer to measure carefully the input impedance of the device that the pickup is connected to and then compute the open circuit response. For me the preferable device is a recording interface.
|
|
|
|
Post by ms on May 4, 2023 14:43:23 GMT -5
AK has a very thorough set of measurements. It is fun to think about limiting cases. A superconducting cover would dissipate no energy, but the induced currents would affect the inductance and therefore the resonance frequency. So it is not necessarily true higher conductivity affects the Q more than low in all cases. However, I do not understand all of his results.
|
|
|
|
Post by ms on May 3, 2023 17:32:49 GMT -5
So, Al and Cu shielding in the control cavity is equally effective against noise we can't hear? And low frequency noise from electric fields that you can hear. For example, if you do not ground the strings, you can hear hum with many pickups. This is from electrical fields. It is not necessary to ground the strings if the pickup is very well shielded, but this usually means shielding the control cavity and cables as well. Nickel silver works; you do not need either Cu or Al. |
|
|
|
Post by ms on May 3, 2023 14:37:38 GMT -5
I have always used various signals containing all relevant frequencies at once to test pickups, but always for measuring, not for listening. Great idea!
|
|
|
|
Post by ms on May 3, 2023 14:29:10 GMT -5
Of course AI got it wrong. There is not enough "I" there so that it can doubt what it learns by looking up things on the internet, and then go learn the physics in order to get it right. AI now knows how to make things sound good to humans, and so for many things "I" means idiot, but many humans still think it is a near genius. This is a very dangerous tool.
|
|
|
|
Post by ms on Apr 26, 2023 17:34:18 GMT -5
Not sure. It does appear that the rankings page allows you do some odd things, like enter the same pickup number more than once. Not sure if the code picks that up. Or if someone does not enter a pickup number for all 6 ranks. One has to assume that everyone who participated took the task seriously. The inability to give equal rankings to more than one pickup is also an apparent limitation. For ranking, a more appropriate UI — i.e. a list that could be reordered by dragging the items or each having shift up/down buttons — should've eliminated the issue of coming up short. And, somewhat related to UI, I would've ideally liked to see the pickup labelling & positioning in the audio matrix randomized per user (say, maybe via their IP address). Note how, other than the obvious exception of PU2 (the Roswell) and that first place was tied, the results have the pickups ranked according to their ordering. Being ranked from 1 st to 6 th (rather than being rated on a scale 1—6, wherein assignment of duplicate points would be allowed) also means that, for each respondent, the points assigned to the pickups are not independent of the other point assignments, thereby making any statistical analysis more complex (at least as far as I know, stats was never my strong point). Insofar as, although the total for any individual pickup should still follow a sextinomial/hexanomial distribution, the combined set of the six totals must follow some other distribution due to their interdependence. ms, without wishing to make work for you, can you share any insight as to what this distribution would be? OK, let's first look at the distribution of the outcome for one pickup. The sextinomial distribution tends towards something much simpler because you are adding 48 numbers together. You can guess what the simpler thing is. (By the way the very simple computer code is shown at the end of this post.) A simulated probability density function (N = 10 million is used for very smooth results) is shown in the figure. A Gaussian (so called normal distribution) is plotted underneath it, but the approximation is so good that it is only very slightly visible. (The mean and standard deviation are listed in the title of the plot.)  The probability of an outcome of 80 or less is very small, but is not accurately given since all the outcomes in the range 0 to 80 are 0. This would be found by summing from 0 to 80 if the numbers in that range were good. In a similar way the probability of 185 or greater is about 0.08; we have accurate numbers in much of this range. The probability that one or more of six will equal or exceed 185 is greater, although the dependencies between the six numbers make that probability harder to determine. # For checking to see if the gitec listening test results # can be gotten by chance. import numpy as np # Routine to produce integers 1 through 6 in random order def ranOr(): x = np.random.rand(6) y = np.argsort(x) return y + 1 # run ranOr 48 times and store the results, then sum the six columms # and return def r48(): z = np.zeros((48, 6)) for i in range(48): z = ranOr()
s = np.zeros(6)
for i in range(6):
s = np.sum(z[:,i])
return s
# Sample density function
def msdf(N):
sdf = np.zeros(288 + 1)
for i in range(N):
y = r48()
sdf[ int(y[0]) ] += 1.
return sdf/N
|
|
|
|
Post by ms on Apr 24, 2023 20:17:29 GMT -5
All the flux change inside a loop of wire counts. The wire does not have to be close to the flux. However, if a certain field line is to count, the loop must not be so big that it includes this line returning to the string as well as coming from the string. (This is to avoid cancelation.) That makes it sound like the distance from the origin of the dipole (if that's the correct description) in the string doesn't affect the output, but it does. BL determined that there's not much point in the coil cross-section being much more than 1/8" square, at least in conventional designs. The Alumitones are a very interesting design. Output isn't really a concern for me, but the gradual high-end roll-off gives them a unique character. The Lace company graciously allowed Becky to make BL's pickups in their building at one point when he was in hospital. Very cool in my book. The law of magnetic induction is correct. BL is not. |
|
|
|
Post by ms on Apr 24, 2023 11:42:55 GMT -5
All the flux change inside a loop of wire counts. The wire does not have to be close to the flux. However, if a certain field line is to count, the loop must not be so big that it includes this line returning to the string as well as coming from the string. (This is to avoid cancelation.)
|
|
|
|
Post by ms on Apr 23, 2023 14:29:22 GMT -5
What could possible make the SD and the Amber sound better than the others below it in the second part of this test? Nothing that I can figure out. After thinking about it, it seemed likely that the top results are just random chance. It also appears that people really did not like the Roswell. In fact, I think that that is the only for sure statistically significant result from this test but maybe people really did not like the Kloopman either.
You can do an actual analysis of this experiment, but I would not unless paid. But I have done a quick computer simulation. First you make a routine that puts the integers 1-6 in some random order every time you call it. Then you make a routine that runs that 48 times (for each of the 48 people). Then you sum over the 48 for each of the six. You then run this a lot of times and see how the six numbers range on the average. Here is a short sequence:
In [75]: gitecLTSim.r48()
Out[75]: array([161., 157., 174., 171., 179., 166.])
In [76]: gitecLTSim.r48()
Out[76]: array([178., 151., 170., 165., 181., 163.])
In [77]: gitecLTSim.r48()
Out[77]: array([173., 180., 174., 152., 154., 175.])
In [78]: gitecLTSim.r48()
Out[78]: array([175., 156., 153., 174., 162., 188.])
In [79]: gitecLTSim.r48()
Out[79]: array([164., 185., 181., 153., 138., 187.])
In [80]: gitecLTSim.r48()
Out[80]: array([163., 167., 165., 176., 157., 180.])
In [81]: gitecLTSim.r48()
Out[81]: array([149., 178., 177., 159., 193., 152.])
You can do this all day, and I doubt that you will get a number as low as 80. However, it is not unusual to get 186 or higher, especially if you consider the need to redistribute as a result of the low number from the Roswell (that is, raise the others a bit).
So I think at least the top four in this test are not distinguishable, and maybe the fifth as well. And there is no surprise that people do not like a dead pickup (that is, a probable brass cover).
|
|
|
|
Post by ms on Apr 23, 2023 14:05:44 GMT -5
I think it's safe to say, it's the cover. The losses are too extreme for the baseplate alone to account for it. They're close to measurements done on other brass cover PAF clones.
A thought - such a response might be perceived differently depending on whether or not there is anything else to compare with. If so, then the drop in treble might trigger some biases, if not, some twiddling of some knobs might find a sound that a musician might find pleasant. In addition to the fact that the subjects were invited to make value judgments, which are obviously going to be influenced by their musical styles.
If I were designing that experiment, I would instead ask them simply to identify them by A-F or whatever. Still some bias, but not begging for it. I didn't follow the entire presentation yet, so I'm not sure. I think it's at least significant that there is correlation between the pickups and the subject ratings, the likely brass covered one that is verified in the plots, was spotted by the participants.
But it also illustrates a problem, when asked for preferences, now from the results you don't know was it, "this pickup is the smoothest/dullest on a scale of 1-5" or was it, "I really like the sound of this one" - which is the question you have been asked. In a way you've done also a survey on preferences, as well as pickups.
I would think, a pickup maker would find it handy to have some data on what people are asking for when they ask for, "a smooth" or "a dull" pickup for example.
You are right, I agree that it is the cover. |
|
|
|
Post by ms on Apr 23, 2023 10:53:16 GMT -5
CuNiFe is low permeability and conductivity. In order to assess how useful it is, consider two ways to increase the output of a pickup using it for pole pieces.
1. Use smaller wire so that you get more in turns the same space.
2. Use a pole piece with higher permeability.
The first results in the output increasing proportionally with the increase in the number of turns, but the inductance increases with the square of the number of turns, limiting the usefulness of this way because of the loss of high frequencies. The second results in the output and the inductance increasing at about the same rate. So I think the only reason to use CuNiFe as a pole piece is if you really have to machine it to make a screw. And you do not.
|
|
|
|
Post by ms on Apr 22, 2023 14:42:31 GMT -5
If you want, or at least are willing, to use a pickup with a low resonant f, you would expect it to be hum bucking, because it is possible and desirable. So what are these pickups for? Surely they are not making the claim that the electrical shielding can reduce magnetic hum any where near as much as the cancellation obtained with a humbucker.
|
|
|
|
Post by ms on Apr 22, 2023 14:19:45 GMT -5
Well, I was born in '48, before there were PAFs, but I agree with Antigua, PAF clones are really SD clones. You make what sells, and you use a little old fashioned BS to make it appear to be what people think they should want. I wonder about the Roswell: does it have a brass cover, or a brass baseplate?
|
|
|
|
Post by ms on Mar 17, 2023 5:30:39 GMT -5
Think of the LCR meter as measuring the ratio of voltage to current at some frequency f, both amplitude and phase. If you have told it that it is measuring a capacitor, it assumes that you are right and then uses the values it measures to compute the capacitance and a loss factor. Same for inductance, and so on. So the capacitance measurement of a pickup must be made at a high enough frequency so that the inductance (in parallel) does not affect the measurement very much.
|
|
|
|
Post by ms on Mar 13, 2023 14:50:39 GMT -5
I think that falls off too slowly on the high frequency side to qualify as a resonance.
|
|
|
|
Post by ms on Mar 2, 2023 10:37:42 GMT -5
Have you compared the result with the more common method of putting a larger exciter between the two sets of poles?
You have shown in another current discussion that different screw heights can make a difference in frequency response when using a small exciter coil. It appears that a very conductive cover (brass), although it can nearly remove the resonant peak, does not cause a significant difference in frequency response between a KW type of coil, and the coil described in this discussion. In this comparison I use a "toothpick coil", that is, air core, but different from the one described above, using #41 wire for more turns per millimeter. First plot the difference between the amplitude in db of the response of the tc minus that of the kWc for an SD SH1 N with no cover. There is some difference age very high frequencies, where it does not matter. The difference at 5 KHz is about 0.06 db and less at lower frequencies. This is not significant. 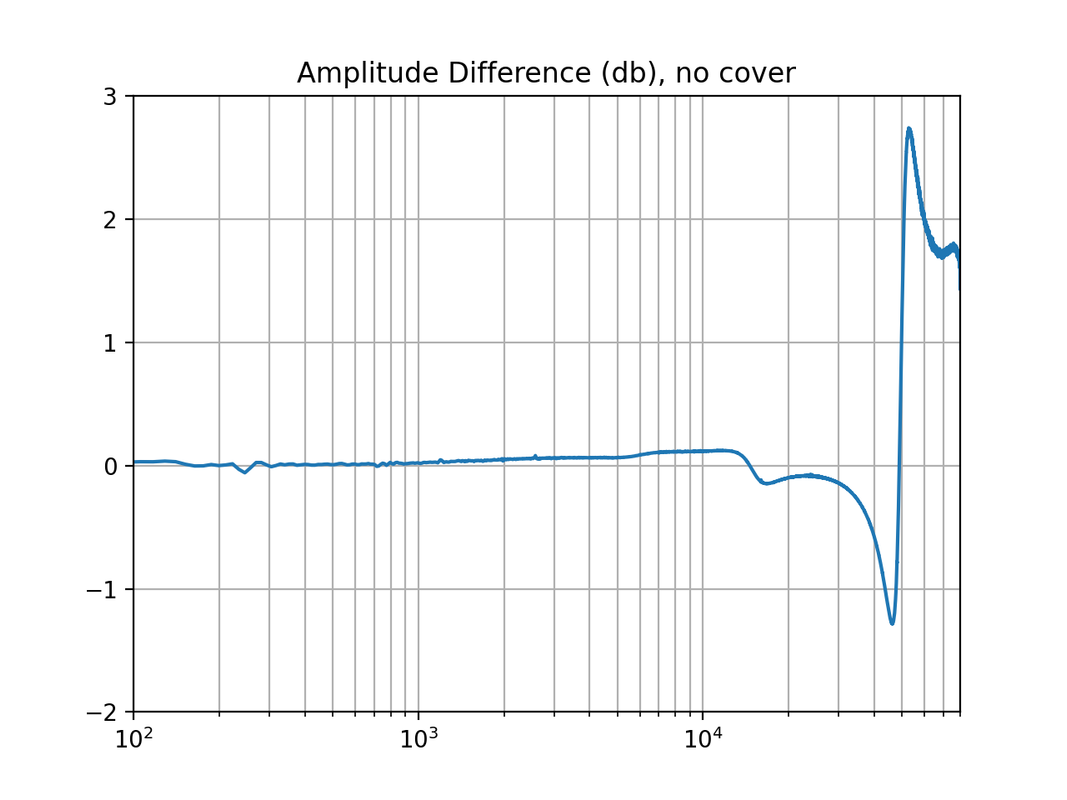 Then plot the same difference with a brass cover in place. The difference at 5 KHz increases to just under 0.5 db, still not significant. 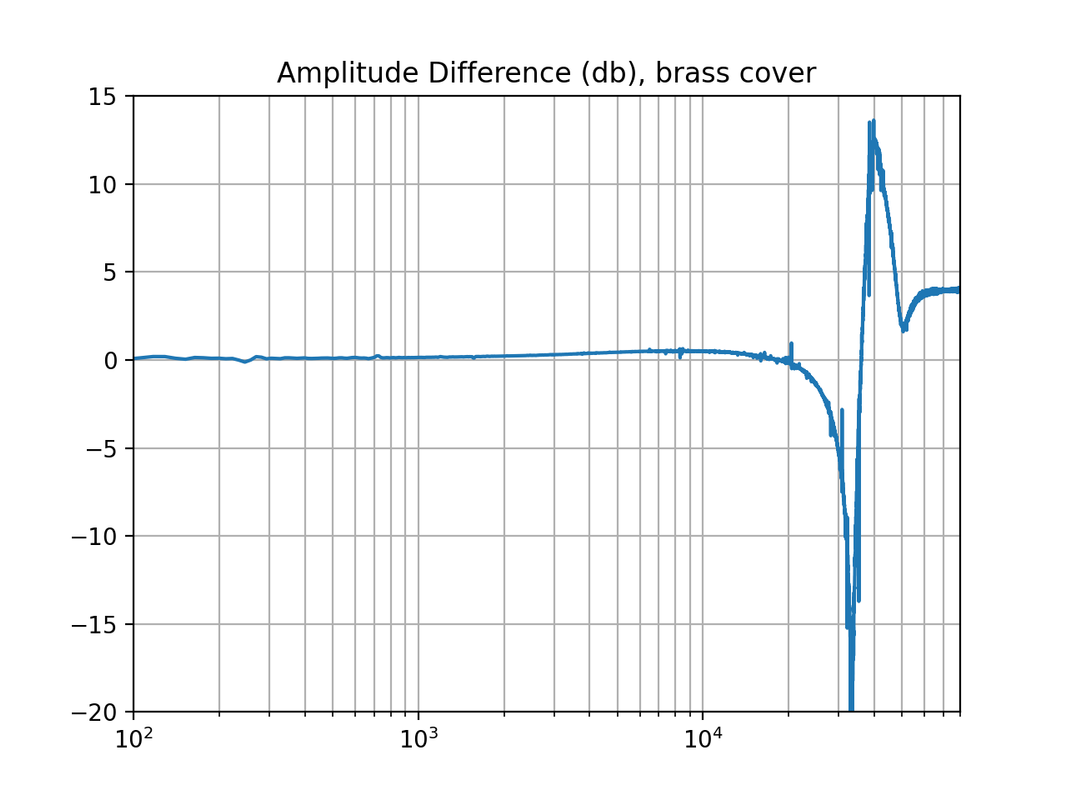 I will attempt aquin43's measurement with the SH1 instead of a mini humbucker. |
|
|
|
Post by ms on Mar 1, 2023 12:46:54 GMT -5
The pickup is a mini humbucker intended for jazz so it is not intended to exhibit a strong resonant peak. It has 12 adjustable poles and a metal case which gives it quite a high shielding loss. When properly balanced for loudness some of the pole screws are below the edge of the casing. Measured individually, these have more high frequency loss than the others. Another uncertainty is caused by it needing a large adjustment of the pole screws to balance it properly so it is probable that some of the signal from the string would come via the rails that carry the pole screws as well as via the screws
This is may be a special case but it does make an argument in favour of the tripole arrangement that you described in another thread.
Thank you, that is a great example of a case I have not looked at. The simplest explanation I can think of (certainly not necessarily correct) is that we have two fields inducing changing flux in the pole piece: 1. directly from the vibrating string; 2. from currents induced in the cover by the vibrating string. I would expect them to vary by different relative amounts as the height of the pole is varied; that is, a greater percent change in the field directly from the string because it is a small source further away. Source 2 increases in strength with respect to source 1 in frequency and therefore alters the frequency response of the sum. |
|
|
|
Post by ms on Feb 25, 2023 6:20:01 GMT -5
I have found at least one pickup that has a different frequency response at each pole when measure with a small coil.
I would be interested in seeing more about that. I have been using small coils for some time, believing that it should matter in some cases, but I have not proven that. Mike |
|
|
|
Post by ms on Feb 24, 2023 6:05:49 GMT -5
I have been comparing two very different exciter coils, and will post results soon. My conclusion is that there is very little difference in the measured frequency response even from coils that are very different. It does not seem to be necessary to illuminate the whole coil, or just one pole piece.
KW recommends 100 ohms in series with the coil, I believe. 30 or 38 AWG does not make a lot of difference to the total resistance.
With some coils you might not get the same current at high and low frequencies; it is important to so, or compensate somehow. I prefer to sample the current with a series resistor and then do cross spectral analysis so that the db and degrees at each frequency are independent of the amplitude and phase of the source.
An alternate approach would be to drive the coil with a very good active current source so that the amplitude and phase are very close to the same at all frequencies. I have not tried that.
|
|
|
|
Post by ms on Feb 19, 2023 11:51:10 GMT -5
A nice clear graph, and clearly what you are doing to relate open circuit to loaded parameters has worked realy well. Can you now also plot the Thevenin impedance vs frequency? (impedance ohms and phase) and would the phase related to that impedance be the same or different to the open-circuit phase plotted above? If its possible to output those parameters of open-circuit voltage, impedance and phase, then its a signature for that pickup that can be fed into any analysis of the circuitry downstream using classical theory. The process of making the loaded response from the the Thevinen equivalent uses the open circuit voltage, both amplitude and phase, and Thevinen impedance, both amplitude and phase. The plot in the first post shows both amplitude and phase of the open circuit voltage. The plot below shows the amplitude and phase of the impedance two ways. We need it with the effect of the C included, of course, and that is the blue and red lines. The lines with the C "unparalleled" are useful for showing that the L is more than just a simple L. One of the advantages of using a Thevinen representation for storing the information necessary to predict the response with any load is that we do not have to explicitly deal with the complexities of the inductor; we just need the measurements. 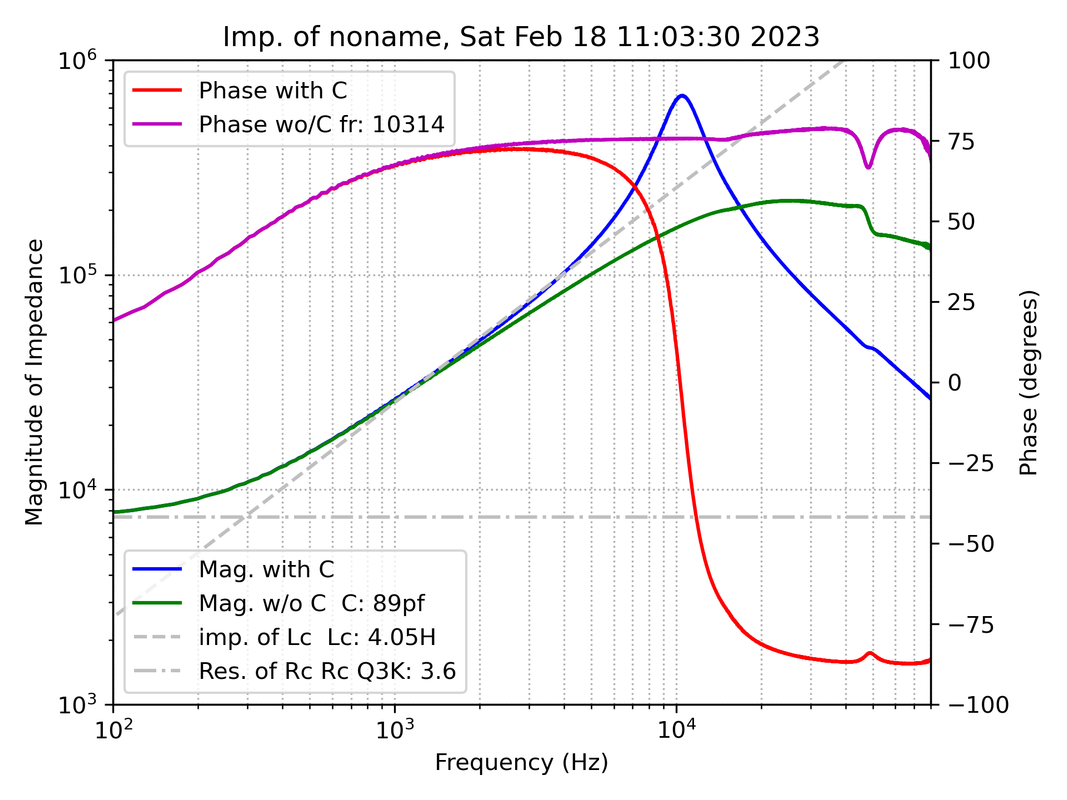
For further processing in Matlab and related applications, it would be convenient to store and retrieve the information in an hdf5 file. I was thinking that this would work for Excel as well, but as far as I can determine you cannot input into Excel from hdf5. It would be necessary to agree on some ASCII format. |
|
|
|
Post by ms on Feb 18, 2023 10:47:24 GMT -5
Compare calculated and measured loaded responses.
In the figure below the red is the measured amplitude of the response, and the magenta is the measured phase. The curves to the right of these are the computed open circuit responses. The curves to the left show the responses when loaded with 500 pf and 500 K ohms in parallel, shown two ways. The underneath solid color curves are the computation from the open circuit response, while the dashed curves are a measurement with that load. There is near perfect agreement. 
|
|
|
|
Post by ms on Feb 18, 2023 5:43:22 GMT -5
Why not? I have no commitment to the idea that you can, but what makes you say so? Measurements, modeling, and theory. |
|
|
|
Post by ms on Feb 17, 2023 19:25:17 GMT -5
And if you use the magnet core also as the bobbin, instead of an air core? You cannot get more than a few times no matter how high the permeability is. |
|
|
|
Post by ms on Feb 17, 2023 18:55:07 GMT -5
At the very least, I have confirmed that the equations do not work for Alnico, apparently because it is not linearly organized. That seems like it would line up with your explanation. I do not understand what you mean. |
|
|
|
Post by ms on Feb 17, 2023 18:53:59 GMT -5
According to your reluctance theory, what would you understand to change if we replaced the permanent magnet with a HyMu-core solenoid at equivalent field strength (relative permeability at this H is about 250,000)? I do not have a reluctance theory. I would prefer that reluctance and pickups were not ever mentioned in the same sentence or paragraph. I am not sure you could get the equivalent permanent magnetic field of an alnico magnet without saturating, but if you assume you can, then you would get about the same inductance and output as steel. The reason is that a short open core does not benefit from very high permeability. The huge "air space" limits the effect. No matter how high you make the permeability, you cannot get more than something like three times the inductance as with an air core. |
|
|
|
Post by ms on Feb 17, 2023 13:24:19 GMT -5
The field of a permanent magnet is not a function of the material's permeability. Permeability is a term relating to applied magnetic fields. Each region in a magnet makes a field and and is potentially influenced by the fields of all other regions, the same nasty "self-consistent" problem you often have. If the material is not permeable, such as almost holds true for neodymium, then there is no significant effect. Alnico is permeable, and so the effects of "applied magnetic fields" from region to region must be accounted for. |
|
|
|
Post by ms on Feb 16, 2023 13:52:00 GMT -5
The distances are given in mm, so I converted to Tesla and m then the result back to Gauss. If I set Br as 3000 I get exactly the table numbers. How are you handling mm if you use Gauss? All I did was check another source for Br of Alnico5. It gave the same number (12700 G) after converting from mT. That is why I think AK is right. Maybe both the other source and AK are wrong, but in any case, the field strength of strat pole pieces is well known, and there is no need to compute from Br. Edit: A couple more things: 1. The equation consists of Br times a unites factor. You have distance/distance, and so distance units do not matter, but all must be the same. 2. I believe this equation is for uniform magnetization. Alnico has sufficient permeability so that this is not completely correct, and you need a self-consistent solution. Exact agreement might be accidental. |
|