Josh
Apprentice Shielder

Posts: 43
Likes: 2
|
Post by Josh on Jun 4, 2023 10:44:38 GMT -5
Hi, I have a nice Siglent scope (SDS2X04XP) with a built in AWG, and bode plotting. I'm new to testing pickups, so I'd love some feedback to see if I'm setting this up correctly, or if there's something I need to change. Here's how I set it up comparing it to your bode plots: 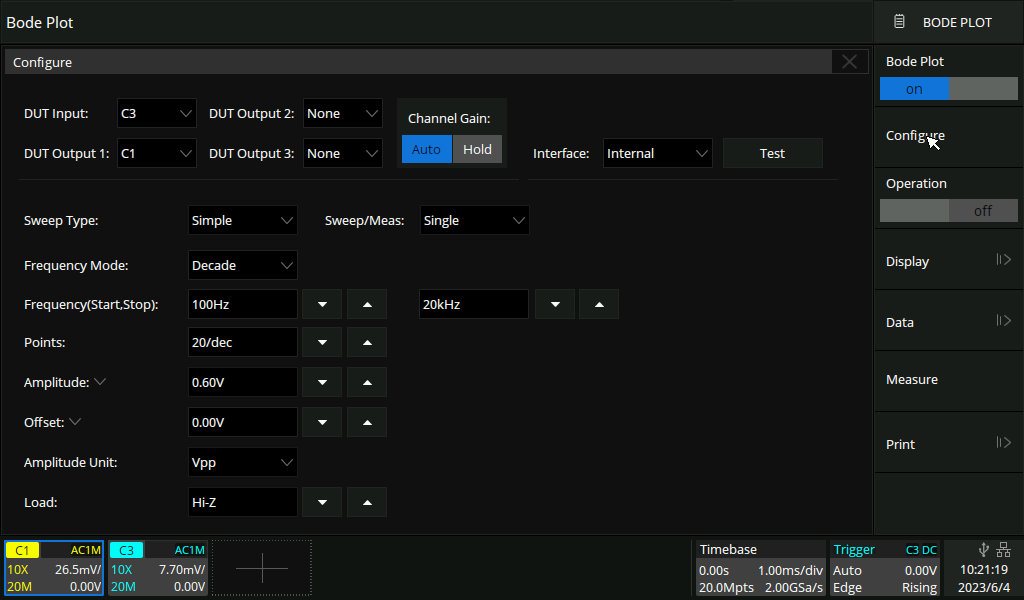 Here's the results on a Lace Hemi Bridge pickup: 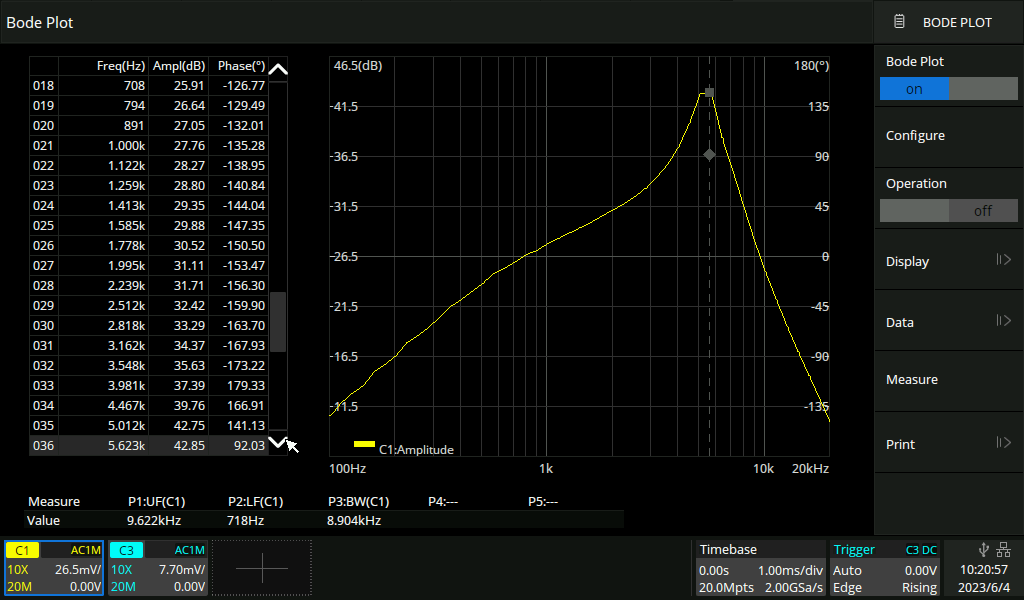 I also tested that pickup on my TH2830 bench LCR meter: Lp: 5.79834H Rd (DCR): 10.2243KΩ Cp: 147.358pF Cs: 148.069pF Q Factor: 2.49549 (Is this useful?) Q, L, R @ 1kHz C @ 100kHz Thanks, Josh |
|
|
|
Post by stratotarts on Jun 4, 2023 11:45:02 GMT -5
What is your test circuit?
|
|
Josh
Apprentice Shielder
Posts: 43
Likes: 2
|
Post by Josh on Jun 4, 2023 13:18:42 GMT -5
I made an exciter coil, that's sitting on top of the pickup. For the test above, that's it. There's a 100Ω resistor on there too, but that was bypassed.
CH1 on the scope is pickup output. CH3 on the scope and the AWG are connected to the exciter coil.
LCR meter was connected directly to the pickup (not at the same time as the bode plot of course 😉).
Thanks,
Josh
|
|
Josh
Apprentice Shielder
Posts: 43
Likes: 2
|
Post by Josh on Jun 4, 2023 15:27:10 GMT -5
I've got another question. Are you all measuring inductance in series or parallel? I thought I saw parallel somewhere. That's what gave me the numbers above.
If I had to guess, I think Lace is measuring inductance in series at 100Hz. That's the only way I was able to get close to their numbers.
Hemi Neck
Lace website:
Resistance: 7.0k
Peak Frequency: 2750
Inductance: 3.5 henries
TH2830: Ls: 3.69066H @ 100Hz
Hemi Bridge
Lace website:
Resistance: 10.0k
Peak Frequency: 2600
Inductance: 4.6 henries
TH2830: Ls: 4.99706H @ 100Hz
|
|
|
|
Post by stratotarts on Jun 4, 2023 16:32:25 GMT -5
Are you connecting the pickup directly to the scope input, with no 10x probe? That will place a 1.0M ohm and about 15-30pF capacitance in parallel with the pickup. Also, in the first message you refer to "your bode plots". Whose bode plots, or which bode plots, are you referring to?
|
|
Josh
Apprentice Shielder
Posts: 43
Likes: 2
|
Post by Josh on Jun 4, 2023 20:03:17 GMT -5
|
|
|
|
Post by antigua on Jun 6, 2023 16:14:26 GMT -5
I have a nice Siglent scope (SDS2X04XP) with a built in AWG, and bode plotting. I'm new to testing pickups, so I'd love some feedback to see if I'm setting this up correctly, or if there's something I need to change. Here's how I set it up comparing it to your bode plots: Here's the results on a Lace Hemi Bridge pickup: I also tested that pickup on my TH2830 bench LCR meter: Lp: 5.79834H Rd (DCR): 10.2243KΩ Cp: 147.358pF Cs: 148.069pF Q Factor: 2.49549 (Is this useful?) Q, L, R @ 1kHz C @ 100kHz Thanks, Josh That's a nice looking device. Measuring Q at 1kHz is good because it's below the resonant peak but high enough to cause eddy current losses, but the L and R are better measured at 100Hz in order to reduce eddy current losses in the calculation made by the meter, and you want it in series also, to tell the meter that the resistance it sees is in series with the inductor. For capacitance it's the opposite, the capacitance is in parallel with the resistance, and you choose a high frequency in order to not only measure above the pickup's resonant peak, but to maximize the capacitive effects over the inductive and resistive. I've never measured a Lace Hemi, so I can't compare, but I suspect the values will be somewhat different if you measure series at 100Hz. |
|
Josh
Apprentice Shielder
Posts: 43
Likes: 2
|
Post by Josh on Jun 8, 2023 8:32:47 GMT -5
I have a nice Siglent scope (SDS2X04XP) with a built in AWG, and bode plotting. I'm new to testing pickups, so I'd love some feedback to see if I'm setting this up correctly, or if there's something I need to change. Here's how I set it up comparing it to your bode plots: Here's the results on a Lace Hemi Bridge pickup: I also tested that pickup on my TH2830 bench LCR meter: Lp: 5.79834H Rd (DCR): 10.2243KΩ Cp: 147.358pF Cs: 148.069pF Q Factor: 2.49549 (Is this useful?) Q, L, R @ 1kHz C @ 100kHz Thanks, Josh That's a nice looking device. Measuring Q at 1kHz is good because it's below the resonant peak but high enough to cause eddy current losses, but the L and R are better measured at 100Hz in order to reduce eddy current losses in the calculation made by the meter, and you want it in series also, to tell the meter that the resistance it sees is in series with the inductor. For capacitance it's the opposite, the capacitance is in parallel with the resistance, and you choose a high frequency in order to not only measure above the pickup's resonant peak, but to maximize the capacitive effects over the inductive and resistive. I've never measured a Lace Hemi, so I can't compare, but I suspect the values will be somewhat different if you measure series at 100Hz. I retested: Hemi Bridge: Ls: 4.99316H Rd: 10.2778kΩ Q: 2.50015 Cp: 149.960pF Hemi Neck: Ls: 3.68769H Rd: 7.22307kΩ Q: 2.63220 Cp: 153.105pF Ls, Rd @ 100Hz, Q @ 1kHz, Cp @ 100kHz. I've found Lace to be pretty consistent in their information. A small variance from batch to batch is likely to be expected, so I think getting within 10% guessing at their method is pretty good. I also ran a new bode plot on the neck pickup, this time using a 100Ω resistor in series with the exciter coil: 
I increased to 50 points/decade to improve the peak. Does the result look right? Should I not be using the 100Ω resistor if the probes are connected directly? Thanks, Josh |
|
|
|
Post by ms on Jun 8, 2023 9:25:27 GMT -5
I am not seeing your plot. (Edit: OK plot appeared.)
The purpose of the 100 ohm reisistor is to make the current nearly constant with frequency. It would be best to verify that this is the case with a measurement.
|
|
|
|
Post by ms on Jun 8, 2023 9:30:03 GMT -5
Antigua, I think Q should be measured at a higher frequency, such as three KHz, because this is in the range of frequencies that one hears as most affecting the brightness of the sound, and so the Q near that frequency is a good indication of the brightness that the pickup can produce.
|
|
Josh
Apprentice Shielder
Posts: 43
Likes: 2
|
Post by Josh on Jun 8, 2023 11:31:48 GMT -5
The primary difference I see in the bode plots is that it looks like the 100Ω resistor on the exciter coil drops the results one order of magnitude. Do I need to adjust something to account for this, or is this the expected dB range?
|
|
Josh
Apprentice Shielder
Posts: 43
Likes: 2
|
Post by Josh on Jun 8, 2023 11:42:29 GMT -5
Antigua, I think Q should be measured at a higher frequency, such as three KHz, because this is in the range of frequencies that one hears as most affecting the brightness of the sound, and so the Q near that frequency is a good indication of the brightness that the pickup can produce. Q @ 3kHz: 3.26238 Q @ 1kHz: 2.50015 |
|
|
|
Post by ms on Jun 8, 2023 17:37:22 GMT -5
Antigua, I think Q should be measured at a higher frequency, such as three KHz, because this is in the range of frequencies that one hears as most affecting the brightness of the sound, and so the Q near that frequency is a good indication of the brightness that the pickup can produce. Q @ 3kHz: 3.26238 Q @ 1kHz: 2.50015 If we use Q = omega*L/R, we expect an increase of three times. We have about 1.3. It seems that eddy current effects are increasing with frequency quickly. |
|
|
|
Post by antigua on Jun 8, 2023 18:55:24 GMT -5
Antigua, I think Q should be measured at a higher frequency, such as three KHz, because this is in the range of frequencies that one hears as most affecting the brightness of the sound, and so the Q near that frequency is a good indication of the brightness that the pickup can produce. That's true, most of the LCRs meters I have and have seen don't offer 3kHz, otherwise it might be a good test frequency for most pickups. I was able to use 1kHz effectively for telling apart nickel silver and brass covers. It seems to be useful when comparing pickups that are like for like. |
|
Josh
Apprentice Shielder
Posts: 43
Likes: 2
|
Post by Josh on Jun 8, 2023 19:50:11 GMT -5
Antigua, I think Q should be measured at a higher frequency, such as three KHz, because this is in the range of frequencies that one hears as most affecting the brightness of the sound, and so the Q near that frequency is a good indication of the brightness that the pickup can produce. That's true, most of the LCRs meters I have and have seen don't offer 3kHz, otherwise it might be a good test frequency for most pickups. I was able to use 1kHz effectively for telling apart nickel silver and brass covers. It seems to be useful when comparing pickups that are like for like. I can test at any of these points on my TH2830: 50Hz, 60Hz, 75Hz, 100Hz, 120Hz, 150Hz, 200Hz, 250Hz, 300Hz, 400Hz, 500Hz, 600Hz, 750Hz, 1kHz, 1.2kHz, 1.5kHz, 2kHz, 2.5kHz, 3kHz, 4kHz, 5kHz, 6kHz, 7.5kHz, 10kHz, 12kHz, 15kHz, 20kHz, 25kHz, 30kHz, 40kHz, 50kHz, 60kHz, 75kHz, 100kHz. If there are some other tests you'd like me to run, let me know. Thanks, Josh |
|
|
|
Post by aquin43 on Jun 9, 2023 8:39:29 GMT -5
Inductance meters model the inductor as a series combination of L and R, which is OK for a spot measurement. The pickup is more complicated than that and one way to model it is to match its impedance with a resistor and two or three inductors in series with resistors across the inductors to represent the losses. If you do this, it is possible to produce a graph showing the equivalent inductance over most of the audio range and also the effective Q of the inductor. For an ideal inductor, the Q would rise with frequency but for the pickup, the inductor Q, ωL/R peaks and then falls again. The graph below shows a two inductor impedance fit to a Little59 bridge pickup. The fit is very close up to 7kHz. The program is very loosely based on the Gitec Pickup Wizard. The impedance is measured separately by a scheme similar to that proposed by ms using, in this case, a Scarlett 2i2 interface.
 |
|
|
|
Post by antigua on Jun 9, 2023 14:12:48 GMT -5
That's true, most of the LCRs meters I have and have seen don't offer 3kHz, otherwise it might be a good test frequency for most pickups. I was able to use 1kHz effectively for telling apart nickel silver and brass covers. It seems to be useful when comparing pickups that are like for like. I can test at any of these points on my TH2830: 50Hz, 60Hz, 75Hz, 100Hz, 120Hz, 150Hz, 200Hz, 250Hz, 300Hz, 400Hz, 500Hz, 600Hz, 750Hz, 1kHz, 1.2kHz, 1.5kHz, 2kHz, 2.5kHz, 3kHz, 4kHz, 5kHz, 6kHz, 7.5kHz, 10kHz, 12kHz, 15kHz, 20kHz, 25kHz, 30kHz, 40kHz, 50kHz, 60kHz, 75kHz, 100kHz. If there are some other tests you'd like me to run, let me know. The Q value is mostly useful in situations where you have two pickups that look the same, but you're not sure if one has different metallurgy properties than the others, such as different covers or pole pole pieces (and probably not much else tbh), and the main reasons it matters in guitar pickups is because it's nice to know what the eddy current production is, or the type of pole pieces. If the eddy currents are high, it means the pickups will have a more aggressive roll off of treble. So the LCR meter subjects the pickup to the test frequency and causes eddy currents, and it causes an apparent resistance which lowers the Q factor. Generally, the lower the Q factor, the higher the conductivity of the metal, the more loss of high end. Also keeping in mind that the geometry of the metal will make a difference, because eddy currents are an electromagnetic effect:  ... so measuring like for like pickups works out best, like Filter'tron to Filter'tron or Strat pickup to Strat pickup, but not Filter'tron to Strat pickup, because the different in physical geometry means that the Q factors will be different without necessarily saying much or anything about how the pickups will sound different, in this case because the Filter'tron's large steel filister screws are unique to that pickup. The two use main use cases I've tried to apply this to is telling apart nickel silver from brass covers with Tele an PAF style pickups, and the other is trying to figure out if a Strat pickup has AlNiCo 5 magnets, or AlNiCo 2 or 3 (which are very similar). I think 1kHz is a good one to test just because meters like DE-5000 and the Extech and in a lot of people's hands already, so they could compare notes, but 3kHz or 4kHz is good as a second or third value, because one you gather enough data you can probably start making new observations about pickups at this test frequency that have not been made before, but also as prices of LCR meters come down over time, 3 or 4 kHz Q measurements might become common place. I actually got a meter for Christmas that does arbitrary frequencies, but it cost around $300, and I'm hoping that meters of this sort will eventually fall below $100 so that more casual pickup enthusiasts can justify the purchase. On a similar note, you might want to measure C at two or three frequencies when you test, 50kHz, 60kHz, 75kHz and 100kHz, and make sure that they're all in agreement, because with a lot of pickups, I've found secondary resonances at higher frequencies, and if you happen to land on one, it will give you a bad reading. The secondary resonance appears to come from imperfections in the coil, that create a "coil with a coil" sort of formation, so they're common with hand guided Strat pickups, where the turns of wire are scattered about, but not at all common with machine wound pickups, which have more uniform layering of wire. Here's an example of a bode plot showing secondary resonances around 70kHz and 150kHz, so a test frequency close to those would give a bad capacitance reading, because the pickup is inductive at those frequencie, but at 40kHz or 100kHz it is capacitive and will give good values.  |
|
|
|
Post by ms on Jun 9, 2023 17:43:55 GMT -5
The Q near the resonance determines the width and height of the resonance, and thus is a big factor in the brightness of the pickup. More subtle audible effects are possible, but, IMO, not proven.
|
|
|
|
Post by aquin43 on Jun 11, 2023 8:20:18 GMT -5
Do any of the LCR meters allow you to take account of the parallel capacitance so that it can be factored out of the measurement?
|
|
Josh
Apprentice Shielder
Posts: 43
Likes: 2
|
Post by Josh on Jun 11, 2023 18:29:30 GMT -5
Do any of the LCR meters allow you to take account of the parallel capacitance so that it can be factored out of the measurement?
Any good LCR meter should give you the choice between measuring L in series or parallel. I've measured in both Ls and Lp, and I've never seen more than a difference of ~1pF between the two modes in any of the pickups I've tested. |
|
|
|
Post by aquin43 on Jun 12, 2023 4:13:54 GMT -5
Do any of the LCR meters allow you to take account of the parallel capacitance so that it can be factored out of the measurement?
Any good LCR meter should give you the choice between measuring L in series or parallel. I've measured in both Ls and Lp, and I've never seen more than a difference of ~1pF between the two modes in any of the pickups I've tested. Sorry, I didn't make it sufficiently clear. Do any of the LCR meters allow you to indicate an assumed capacitance in parallel with the inductor so that it can be factored out of the measurement? If you consider how any of these impedance measurement work, the only information available to the meter is the amplitude and phase of a voltage across the device under test and their relationship to the current through it. The components of inductance and resistance are computed from these two parameters on the assumption that the DUT is an inductor with either a series or parallel resistor. We know that a pickup includes an overall parallel capacitor and it would be useful if an estimate of this capacitance could be given to the meter so that the measurement could be refined. Alternatively, if the meter can instead give a reading of the measured impedance, it would be possible to compute a more refined L, R and Q separately.
|
|
|
|
Post by ms on Jun 12, 2023 6:54:54 GMT -5
I believe that you can compute the measured impedance from the measured values as part of the more refined analysis.
If you want the meter to compute L, R, and C, it needs to measure at two or more frequencies. It would be simplest to measure at a high frequency to get C, but there are potential complications with pickup coils wound in strange patterns.
|
|
Josh
Apprentice Shielder
Posts: 43
Likes: 2
|
Post by Josh on Jun 16, 2023 11:31:52 GMT -5
I built my integrator and calibrated it on my scope (though the square wave wasn't perfect, it was pretty close). I ran the bode plot a few times at different voltage levels coming from the AWG, and it doesn't seem to matter. Here's my test setup: 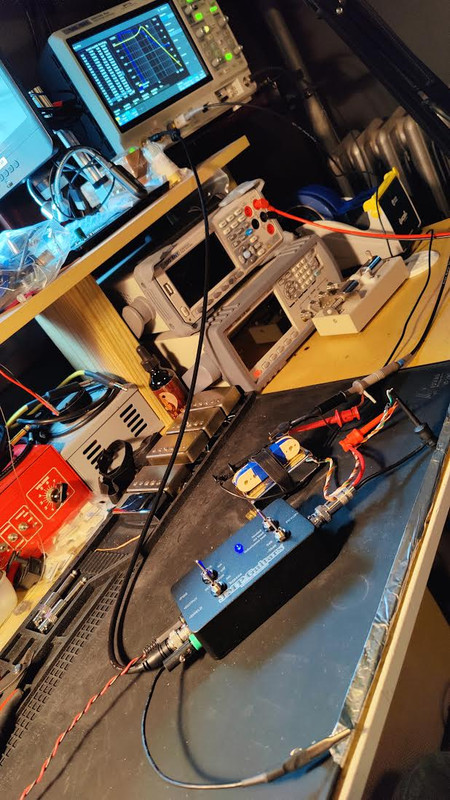 AWG @ 1.0Vpp:  AWG @ 2.0Vpp:  AWG @ 3.0Vpp:  This was my final bode plot settings:  What do you think? Does it look good? Should I change anything about the setup or settings? Thanks, Josh |
|
|
|
Post by stratotarts on Jun 16, 2023 13:08:55 GMT -5
Josh, that looks good to me. A more certain analysis requires setting up reference markers on the scope. For example setting one horizontal marker to the 200Hz level, and setting the other marker to the tip of the peak. Then you can read off the numerical difference. It's also more revealing if you can superimpose the loaded and non-loaded plots.
I see that you have installed an input jack on the integrator. I specifically avoided that due to the increased capacitance, but it is small, and if you measure it you can factor that into your calculations or conclusions.
I'm not sure from the image, but it looks like maybe your input gain is set to 0dB. Normally, it is better to use the -20dB input gain setting as it has proved to fit the dynamic range of most measurements better.
|
|
Josh
Apprentice Shielder
Posts: 43
Likes: 2
|
Post by Josh on Jun 16, 2023 16:04:21 GMT -5
Josh, that looks good to me. A more certain analysis requires setting up reference markers on the scope. For example setting one horizontal marker to the 200Hz level, and setting the other marker to the tip of the peak. Then you can read off the numerical difference. It's also more revealing if you can superimpose the loaded and non-loaded plots.
I see that you have installed an input jack on the integrator. I specifically avoided that due to the increased capacitance, but it is small, and if you measure it you can factor that into your calculations or conclusions.
I'm not sure from the image, but it looks like maybe your input gain is set to 0dB. Normally, it is better to use the -20dB input gain setting as it has proved to fit the dynamic range of most measurements better.
Thanks, I'll try that out. Good eye on the gain switch, I'll try that too. I'm not too worried about the capacitance from the jack, I used significantly less wire in my build:  Here's the other side of the PCB:  Does it really matter jack vs. permanent leads if we're compensating the signal either way? Thanks, Josh |
|
|
|
Post by stratotarts on Jun 16, 2023 21:50:53 GMT -5
The calibration adjustment does not compensate for variable capacitance present at the input leads. It is intended to compensate for (and isolate mostly from the measurements) the op amp circuit input impedance.
It is a nice build, the input capacitance I was worried about comes from the connector itself and also any coaxial cable attached to it, not the wiring to it. Capacitance is determined strongly by surface area, as the other factors like distance between "plates" are similar, it takes prominence. I have built models with banana jacks, but didn't have a chance to measure the difference in capacitance. I do consider at least visually, or from a design standpoint, an estimate of the small capacitance which is not usually specified by the manufacturer because it is not important in the applications they are used in. For example, a BNC connector might usually be used with coaxial cable, in which the capacitance is mostly nullified by it's inclusion into a transmission line. But coaxial line becomes mostly capacitive when it is used well below radio frequencies, e.g. audio.
However also, your implementation has two parts, the BNC jack and the BNC plug/test clip assembly shown. I would judge, more capacitance due to the assembly then the jack if used with a bare plug. In truth I want to move to a screw terminal strip arrangement for test leads.
The calibration of the input network is done from a low impedance signal source, such that only the in circuit capacitance value of 4pF is compensated. But there is no practical way that I know of (at least any simple way) to compensate for additional parasitic loads that exist, at least in a direct measurement input circuit. If you are taking numerical measurements you can compensate for it mathematically later on.
Typical audio line level drivers and loads are designed to minimize the effects of that capacitance (hence why you may not see pF specs for a BNC or audio connector). A pickup circuit has too high an impedance to be similarly insensitive.
I repeat, the sensible thing to do is measure it. My target input capacitance is 10pF which includes the 4pF input load and 6pF stray capacitance. It's on the low end of the scale that I can measure, but I have done that and it is close. If you know the input capacitance you can simply add it to your calculations. In my spreadsheet, that is how it is done. The estimated or measured input capacitance is entered in a cell in the sheet. That value is subtracted when pickup calculations are done.
There is inevitably some capacitance, and it is worth considering that the capacitance of the pickup which is much greater, is still yet much less than the capacitance of the entire system. This means that it may have more analytical than practical value.
|
|
Josh
Apprentice Shielder
Posts: 43
Likes: 2
|
Post by Josh on Jun 16, 2023 22:34:13 GMT -5
With my LCR kelvin leads connected to the mini grabbers attached to BNC, Integrator set to bypass, load set to no load: Cp @ 100kHz = 16.3901pF Cs @ 100kHz = 16.5564pF With the kelvin leads connected inside the device (nothing connected externally to BNC): 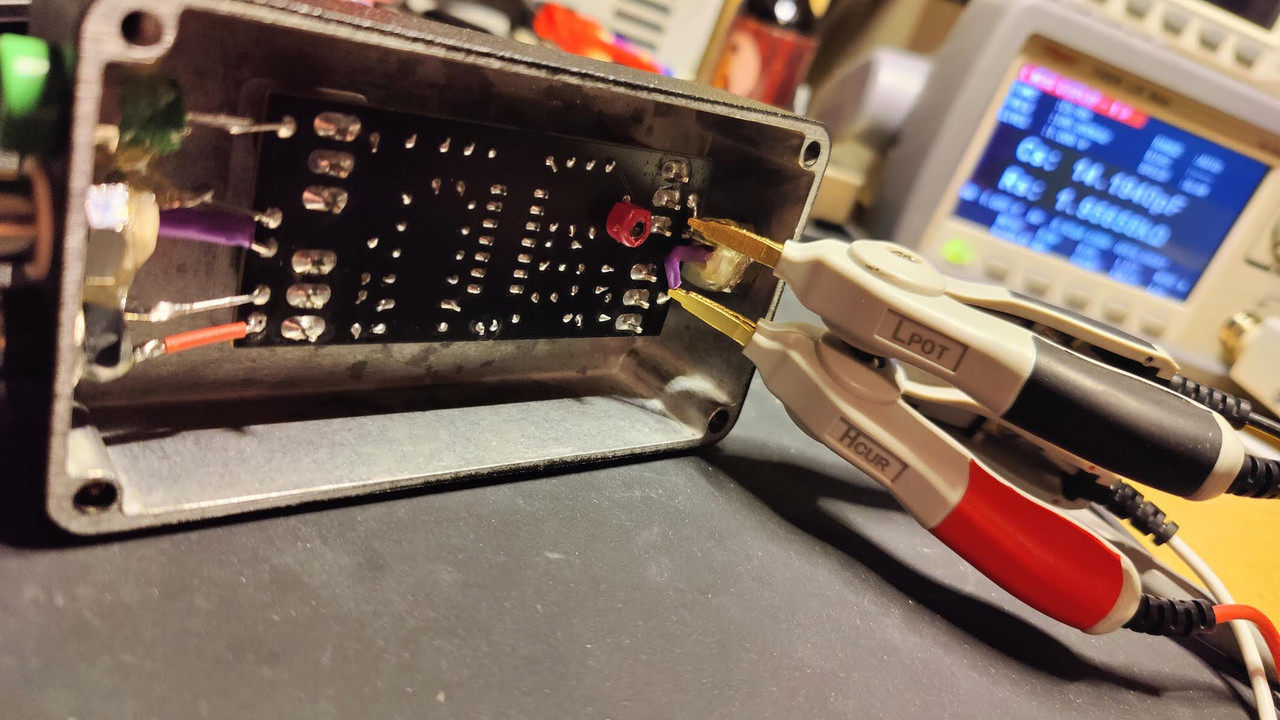 Cp @ 100kHz = 14.0822pF Cs @ 100kHz = 14.1940pF The external connector appears to be only adding ~2pF. Thanks, Josh |
|
|
|
Post by stratotarts on Jun 16, 2023 22:53:40 GMT -5
That's perfectly acceptable and a good thing to know. Thanks for the measurement. I've experience, people have different preferences about how to connect, and I'm trying to find a way to accommodate most of them. The bare wires I have now are that way for the necessity of the least possible capacitance. In the beginning of my investigation of the subject, that seemed necessary. I provide it subsequently because it's proven and has good accuracy. I am considering the terminal strip for that reason, that people can more easily attach whatever they like to it.
|
|
Josh
Apprentice Shielder
Posts: 43
Likes: 2
|
Post by Josh on Jun 17, 2023 10:31:13 GMT -5
When I get some more BNC jacks in, I'll measure them outside the circuit with the plugs. I imagine the chassis isolated version I chose should have less of an effect on the input capacitance. I'll also test some banana jacks, which I would assume should also be fairly low impact. I think your PCB design is fine, people can connect what they want. I only made changes to the silkscreens and a couple traces that were a little close. I wish I thought ahead enough to add b.silkscreen markings for the external connections. I updated my files in case I ever order it again, but I have 9 more boards, so that will probably never happen lol. I ran the tests you suggested on the Hemi neck pickup: Setup:  No load, 200Hz:  No load, peak:  Loaded, 200Hz:  Loaded, peak:  Superimposing the plots over each other isn't as easy this way unless I can make the scales match (I'll play around later and see if I can). OTOH, I can export the data from the scope and a graph should be able to be made from that. Thanks, Josh |
|
Josh
Apprentice Shielder
Posts: 43
Likes: 2
|
Post by Josh on Jun 17, 2023 12:11:33 GMT -5
Hemi bridge, no load, 200Hz:  Hemi bridge, no load, peak:  Hemi bridge, loaded, 200Hz:  Hemi bridge, loaded, peak:  |
|


