Josh
Apprentice Shielder

Posts: 43
Likes: 2
|
Post by Josh on Jun 17, 2023 19:27:50 GMT -5
I learned a new trick (coughbasic functioncough) with my scope:  That's a different pickup. Obviously. 😉 |
|
Josh
Apprentice Shielder
Posts: 43
Likes: 2
|
Post by Josh on Jun 17, 2023 19:43:13 GMT -5
Here's that same pickup unloaded:  |
|
Josh
Apprentice Shielder
Posts: 43
Likes: 2
|
Post by Josh on Jun 17, 2023 23:29:16 GMT -5
I figured out how to set the scale correctly/manually so I can compare the plots:  Yellow is loaded. |
|
|
|
Post by antigua on Jun 18, 2023 11:56:44 GMT -5
That's looking pretty good. Having them overlap in usually a must, because so many of these tests are comparing one thing to another. That's why I like the Velleman, even though it's crude, it doesn't require much work to create comparison plots. Only a few times have I had to take the screen shots and manually put them together with an image editing program. Another useful feature of the Velleman is overlaying text on the plot, so that if I only have the plot image, I can tell what pickup or test I was doing. I've found a lot of my own experiments with Google Images just going off of the text on the image itself. I could do all this with Photoshop, but that would increase the time required to test a given pickup and post the information by a lot.
|
|
Josh
Apprentice Shielder
Posts: 43
Likes: 2
|
Post by Josh on Jun 18, 2023 12:52:46 GMT -5
That's looking pretty good. Having them overlap in usually a must, because so many of these tests are comparing one thing to another. That's why I like the Velleman, even though it's crude, it doesn't require much work to create comparison plots. Only a few times have I had to take the screen shots and manually put them together with an image editing program. Another useful feature of the Velleman is overlaying text on the plot, so that if I only have the plot image, I can tell what pickup or test I was doing. I've found a lot of my own experiments with Google Images just going off of the text on the image itself. I could do all this with Photoshop, but that would increase the time required to test a given pickup and post the information by a lot. I hear that, but I already have a lot of really nice test equipment, I might as well use it. 😉 So now that we've got the above info, what is it telling me? Why do we want to compare the loaded and unloaded traces? What do you see when you look at the above plot? Thanks, Josh |
|
Josh
Apprentice Shielder
Posts: 43
Likes: 2
|
Post by Josh on Jun 19, 2023 12:20:15 GMT -5
I figured out how to work with the CSV data from the bode plots in Excel (though I still have to learn to format / scale it better):  |
|
Josh
Apprentice Shielder
Posts: 43
Likes: 2
|
Post by Josh on Jun 19, 2023 21:15:24 GMT -5
Josh, that looks good to me. A more certain analysis requires setting up reference markers on the scope. For example setting one horizontal marker to the 200Hz level, and setting the other marker to the tip of the peak. Then you can read off the numerical difference. It's also more revealing if you can superimpose the loaded and non-loaded plots. I need some clarification here if you have a moment. What numerical difference am I looking for here? The dB or Hz? Are we looking for PeakHz - 200Hz? Or dB@Peak - dB@200Hz? I've figured out a lot of stuff in Excel, and I want to share it here, but I need to know what numbers I'm after. I'd also like opinions on what the data means. Thanks, Josh |
|
|
|
Post by antigua on Jun 19, 2023 22:24:38 GMT -5
So now that we've got the above info, what is it telling me? Why do we want to compare the loaded and unloaded traces? What do you see when you look at the above plot? From the above plot I can see that the pickup would pair well with 500k pots, with the loaded peak only rising by about 2dB, and the loaded resonant frequency of 2.3kHz is sort of "hot PAF" territory for a humbucker, and if it's a single coil pickup, it's going to be a bold sounding pickup without much high end presence, like a hotter Tele bridge pickup or a hotter ceramic pickup from an import guitar. Most of the time, the overlapping plots are interesting when you have two pickup that are supposedly alike, but end up being different, and the overlapping plots show the extent to which they are different. Or less often, they're supposed to be different but are actually the same. The nice thing about the loaded and unloaded plot lines in one image is partly just that it keeps the data together in one place. The contrast between the two doesn't say much other than allow you to guess how much intrinsic capacitance is present, where the farther apart the frequencies are, the less capacitance there is. But there is something interesting about your plot with the loaded and unloaded in one view, the unloaded plot has a faint dip in output ahead of the resonant peak, but if you look at the loaded plot, that dip is not there. We see that dip with Filter'trons, and I'm still not entirely sure why it happens with Filter'trons and not with PAF style humbuckers (although it has been successfully modeled with LT spice as a three coil transformer, pickup, string and eddy current metal). To see that happen here adds a data point that might be useful later. |
|
|
|
Post by ms on Jun 20, 2023 5:56:59 GMT -5
The dip before resonance seems to be greatest in pickups with a lot of metal, such as a thick brass cover. More eddy currents, I suppose.
Edit: Maybe loading broadens the peak, tending to cancel out the dip.
|
|
|
|
Post by aquin43 on Jun 20, 2023 12:27:31 GMT -5
I would say that pretty well every pickup response can be considered as made up of two cascaded filter responses. There is a 2nd order low pass with some sort of a peak and also a more or less first order low pass shelf. The low pass shelf is caused by the eddy current losses and is essentially unaffected by loading. The 2nd order low pass is very much affected by loading. If the low pass shelf starts well before the 2nd order part starts a steep rise to the peak, the pickup will show the scoop in the response.
|
|
|
|
Post by antigua on Jun 20, 2023 18:12:56 GMT -5
I would say that pretty well every pickup response can be considered as made up of two cascaded filter responses. There is a 2nd order low pass with some sort of a peak and also a more or less first order low pass shelf. The low pass shelf is caused by the eddy current losses and is essentially unaffected by loading. The 2nd order low pass is very much affected by loading. If the low pass shelf starts well before the 2nd order part starts a steep rise to the peak, the pickup will show the scoop in the response.
That's a little abstract for me, but do you have any theory why the Filter'tron shows the effect so dramatically compared to the PAF type? They have the same overall layout, but the proportions of the parts are a lot different. IIRC, the filister screws are mostly what is responsible for the scoop, but it's not clear why the effect is much different as compared with APF screws and slugs. |
|
Josh
Apprentice Shielder
Posts: 43
Likes: 2
|
Post by Josh on Jun 21, 2023 11:38:56 GMT -5
I think I'm pretty close here with setting up my template:  Can anybody tell me the point of the inductance test line? That doesn't represent the actual inductance. Is that used to calculate the inductance somehow? |
|
|
|
Post by antigua on Jun 21, 2023 12:36:11 GMT -5
I think I'm pretty close here with setting up my template: Can anybody tell me the point of the inductance test line? That doesn't represent the actual inductance. Is that used to calculate the inductance somehow? The inductance test plot is not really needed once you determine the inductance through one means or another, it's just for calculating the inductance of the pickup based on the resonant peak with a large know value for C, which is 4.7nF according to the schematic. Here's some javascript I for from chatgpt to do the work (and it seems to work): function calculateInductance(fr, C) {
let L = 1 / (4 * Math.PI**2 * fr**2 * C); // formula to calculate the inductance
return L;
}
let fr = 944.06; // Replace with the resonant frequency (in Hz) with known capacitance
let C = 4.7e-9; // Capacitance in Farads (4.7nF = 4.7e-9 F)
console.log(calculateInductance(fr, C)); // L = 6.047045154479244 henries
|
|
|
|
Post by ms on Jun 21, 2023 14:40:38 GMT -5
I would say that pretty well every pickup response can be considered as made up of two cascaded filter responses. There is a 2nd order low pass with some sort of a peak and also a more or less first order low pass shelf. The low pass shelf is caused by the eddy current losses and is essentially unaffected by loading. The 2nd order low pass is very much affected by loading. If the low pass shelf starts well before the 2nd order part starts a steep rise to the peak, the pickup will show the scoop in the response.
That's a little abstract for me, but do you have any theory why the Filter'tron shows the effect so dramatically compared to the PAF type? They have the same overall layout, but the proportions of the parts are a lot different. IIRC, the filister screws are mostly what is responsible for the scoop, but it's not clear why the effect is much different as compared with APF screws and slugs. Are you sure it is the fillister screws? It makes more sense to me that the "scoop" (not part of the resonance) is caused by metal outside of the coil itself, such as a cover that can block signal at higher frequencies. I played around with a Filter'tron recently, and thought that it was the thick brass cover that did it. (Perhaps you made some measurements on a Filter'tron a while ago, but I did not find the discussion in order to review your results.) |
|
|
|
Post by antigua on Jun 21, 2023 15:08:14 GMT -5
That's a little abstract for me, but do you have any theory why the Filter'tron shows the effect so dramatically compared to the PAF type? They have the same overall layout, but the proportions of the parts are a lot different. IIRC, the filister screws are mostly what is responsible for the scoop, but it's not clear why the effect is much different as compared with APF screws and slugs. Are you sure it is the fillister screws? It makes more sense to me that the "scoop" (not part of the resonance) is caused by metal outside of the coil itself, such as a cover that can block signal at higher frequencies. I played around with a Filter'tron recently, and thought that it was the thick brass cover that did it. (Perhaps you made some measurements on a Filter'tron a while ago, but I did not find the discussion in order to review your results.) Yeah, this is an old test, there is no cover in this test, from here guitarnuts2.proboards.com/thread/7785/tv-jones-classics-analysis-review |
|
|
|
Post by ms on Jun 22, 2023 6:01:21 GMT -5
I remember that plot. Unusual screws, yes. I do not understand how this works.
|
|
Josh
Apprentice Shielder
Posts: 43
Likes: 2
|
Post by Josh on Jun 22, 2023 14:09:52 GMT -5
I'm content with my Excel template now, so I ran the tests with two pickups I made. Both are metal covered PAF(ish) humbuckers. The colors are the heat shrink tubing I used to identify them on their wires. Yellow: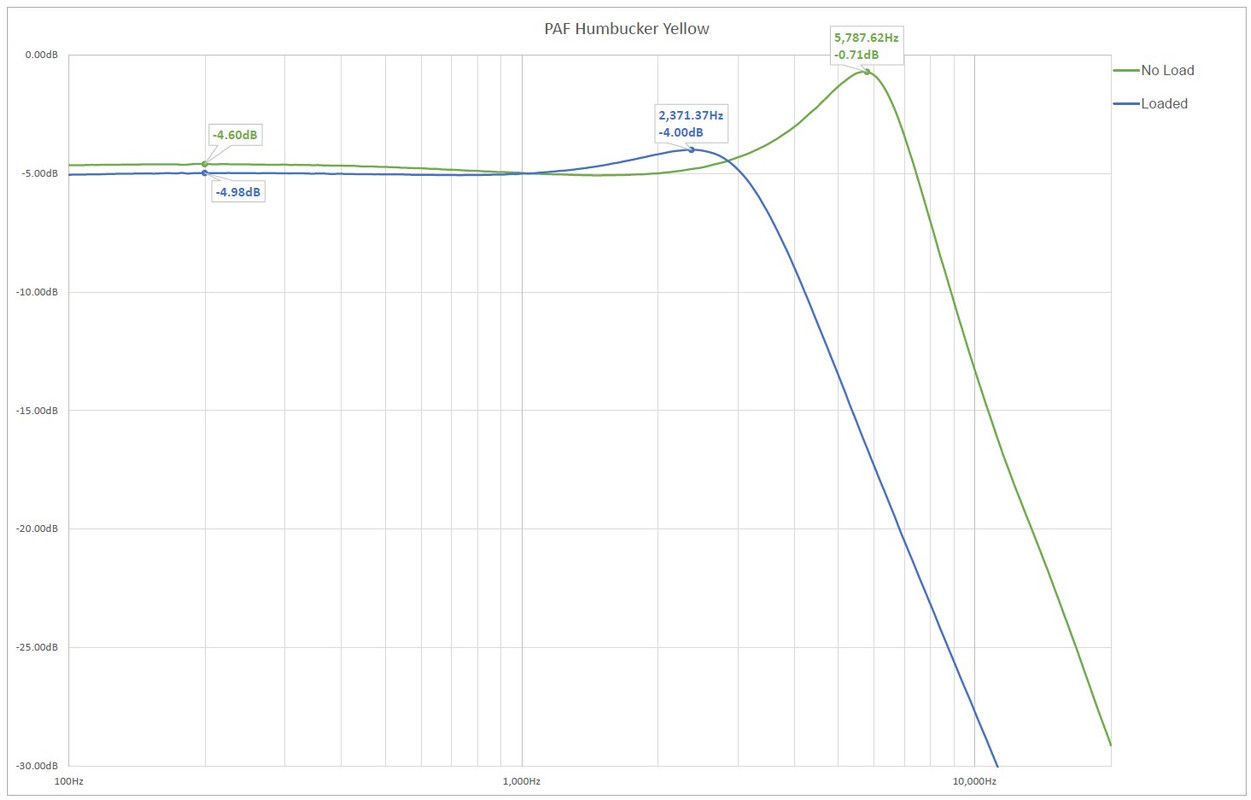 Clear: Clear: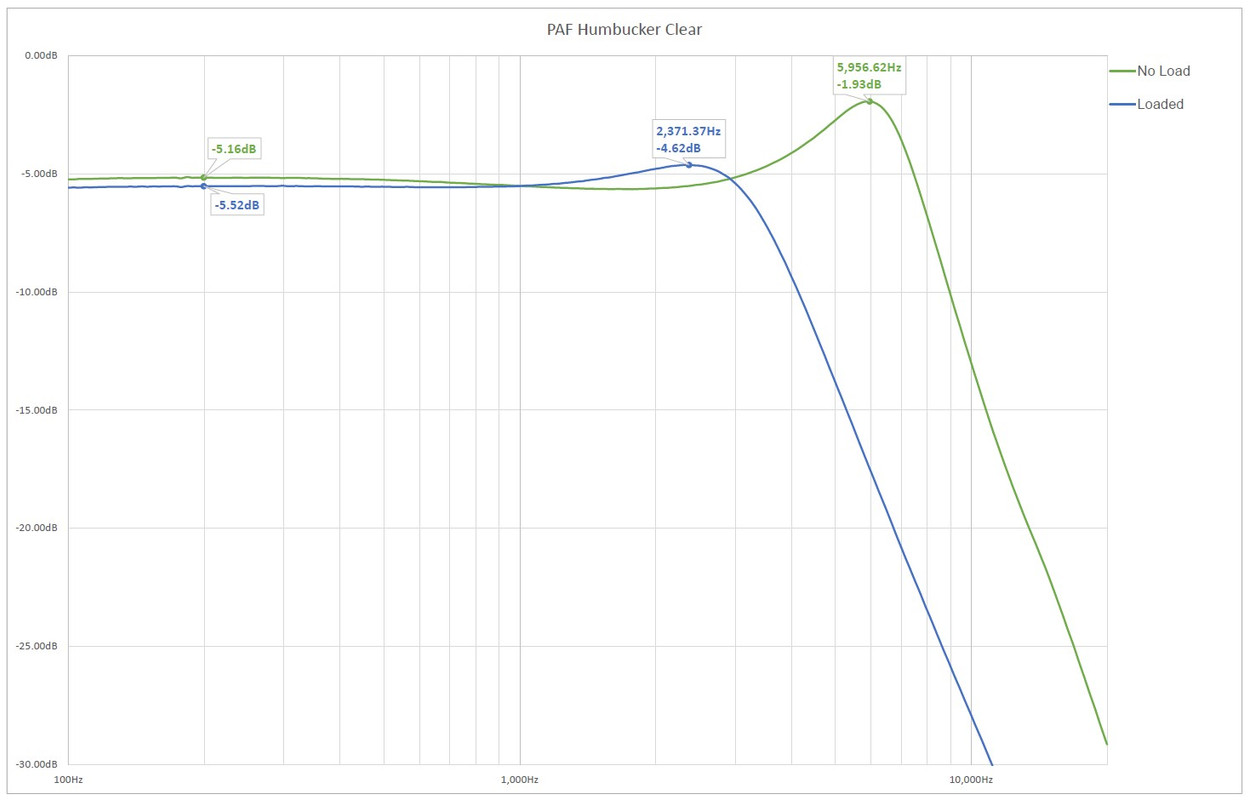 Yellow: Yellow:
Ls 5.28430H Rd 8.84232kΩ Cp 116.947pF Q 1.98747 Clear:
Ls 5.21155H Rd 8.61397kΩ Cp 107.665pF Q 1.96959 Ls @ 1kHz, Rd @ 1kHz, Cp @ 100kHz, Q @ 3kHz, measurements taken on TH2830 LCR. Yellow has an A2 magnet; Clear I can't remember offhand, likely A3 or A4. Their plots seem quite similar to me, with the Yellow plots looking slightly hotter. Do you agree with that? If so, I would imagine the pair would probably work well together with Yellow in the bridge position. Thoughts? Thanks, Josh |
|
|
|
Post by antigua on Jun 22, 2023 20:06:19 GMT -5
It's hard to compare the output amplitudes of pickups to a fine degree, because such a small variation in the driver coil distance from the pickup can impact it, but moreover the thickness of the bobbin can impact it, and would it be right to say a pickup has higher output just because it has a thinner bobbin? In any event, the difference of about 1dB is not perceptible. Personally I won't say it's perceptible until the difference is 3dB, and even then it can't be oversold, considering how much this difference is overshadowed but how near or far the pickup is mounted from the strings. To say a pickup is hotter seems to not just mean is has a higher output, but also features the the tonal difference of a lower resonant peak as well, and sometimes more the latter than the former.
One thing that would really help, if you can do this with Excel somehow, is show the dB difference, rather than the absolute value, for example, for the Yellow unloaded, the absolute difference of -4.60dB and -0.71dB is 3.89dB , so that's the overall amplitude increase at resonance, and that's good info to have when you're comparing pickups based on numbers alone.
The Yellow pickup has a very slightly higher unloaded Q factor, suggesting that the eddy current loss or DC resistance is slightly higher. The pickups are identical for all intents and purposes, though if one of them has a strong magnet, it will interact with the guitar strings differently at a given height.
|
|
Josh
Apprentice Shielder
Posts: 43
Likes: 2
|
Post by Josh on Jun 22, 2023 20:34:48 GMT -5
It's hard to compare the output amplitudes of pickups to a fine degree, because such a small variation in the driver coil distance from the pickup can impact it, but moreover the thickness of the bobbin can impact it, and would it be right to say a pickup has higher output just because it has a thinner bobbin? In any event, the difference of about 1dB is not perceptible. Personally I won't say it's perceptible until the difference is 3dB, and even then it can't be oversold, considering how much this difference is overshadowed but how near or far the pickup is mounted from the strings. To say a pickup is hotter seems to not just mean is has a higher output, but also features the the tonal difference of a lower resonant peak as well, and sometimes more the latter than the former. One thing that would really help, if you can do this with Excel somehow, is show the dB difference, rather than the absolute value, for example, for the Yellow unloaded, the absolute difference of -4.60dB and -0.71dB is 3.89dB , so that's the overall amplitude increase at resonance, and that's good info to have when you're comparing pickups based on numbers alone. The Yellow pickup has a very slightly higher unloaded Q factor, suggesting that the eddy current loss or DC resistance is slightly higher. The pickups are identical for all intents and purposes, though if one of them has a strong magnet, it will interact with the guitar strings differently at a given height. Oh yeah, I already did that but forgot to add it to the chart page. Here's the yellow paf:  Here's the clear paf:  I wish I could find the paper I wrote the magnet details on. 🙄 Oh well, lol. Here's a different question. I made a third pickup at the same time as those two, but it's much different. I'm guessing it's junk and I should salvage the reusable stuff, but please let me know if I'm wrong:  This plot is funny. I was wondering for a second why there was a callout at 183Hz, and then I realized that was the peak Excel chose. 🤣 All 3 of the pickups I made that day are identical except for the magnets. Or the screw ups. Thanks, Josh |
|
|
|
Post by antigua on Jun 23, 2023 1:24:33 GMT -5
Here's a different question. I made a third pickup at the same time as those two, but it's much different. I'm guessing it's junk and I should salvage the reusable stuff, but please let me know if I'm wrong: This plot is funny. I was wondering for a second why there was a callout at 183Hz, and then I realized that was the peak Excel chose. 🤣 That double hump is odd. I see noise spikes at 120Hz, 180Hz and 300Hz, harmonics of 60Hz, so that must be AC mains noise. The double dip in the loaded plot is very strange, but I notice the second peak matches the frequency of the unloaded plot, which it makes me wonder if the wiring of the humbucker is/was messed up somehow, maybe one of the coils became shorted, something like that. |
|
Josh
Apprentice Shielder
Posts: 43
Likes: 2
|
Post by Josh on Jun 23, 2023 10:24:00 GMT -5
That double hump is odd. I see noise spikes at 120Hz, 180Hz and 300Hz, harmonics of 60Hz, so that must be AC mains noise. The double dip in the loaded plot is very strange, but I notice the second peak matches the frequency of the unloaded plot, which it makes me wonder if the wiring of the humbucker is/was messed up somehow, maybe one of the coils became shorted, something like that. Both of those things make it sound to me like the coil series connection is bad (or one of the coils), but it's odd because the LCR measurements aren't crazy: Ls 3.51014H Rd 8.53382kΩ Cp 117.420pF Q 1.80077 The inductance is obviously lower than the others. I wonder if one of the coils is shorted, or if I melted something in the wax pot. Next time I make pickups, I'm doing plots before covers/potting/full wires, etc. I might remove the cover and explore if I feel like making a mess. Thanks, Josh |
|
|
|
Post by aquin43 on Jun 29, 2023 7:48:45 GMT -5
I would say that pretty well every pickup response can be considered as made up of two cascaded filter responses. There is a 2nd order low pass with some sort of a peak and also a more or less first order low pass shelf. The low pass shelf is caused by the eddy current losses and is essentially unaffected by loading. The 2nd order low pass is very much affected by loading. If the low pass shelf starts well before the 2nd order part starts a steep rise to the peak, the pickup will show the scoop in the response. That's a little abstract for me, but do you have any theory why the Filter'tron shows the effect so dramatically compared to the PAF type? They have the same overall layout, but the proportions of the parts are a lot different. IIRC, the filister screws are mostly what is responsible for the scoop, but it's not clear why the effect is much different as compared with APF screws and slugs. My conclusion is suggested by the very simple Tele-Tucson model where the exciting flux follows two paths to the coil, directly and via the lossy components. The combination of the two paths produces the low pass step in the coil excitation and the coil inductance and capacitance (plus load) produces the basic flat low frequency response with an hf peak. The two cascaded responses produce the scoop if the loss roll-off starts well below the peak frequency.
I don't have a filtertron but it is clear that the flux concentration in the thin section of the pole screws increases losses and so lowers the lf roll off frequency as shown in the plots from the two coils of a PAF below where you have the same resonator but different paths to the coil.
 Losses in a cover can, of course, add an additional roll off. |
|
|
|
Post by antigua on Jun 29, 2023 13:44:31 GMT -5
The Filter'tron screws are definitely larger than the PAF screws, and that seems like a plausible reason for it to have stronger eddy current losses. The idea that the wider cross section causes a stronger eddy current roll-off seems plausible, but neither PAF or Filter'tron screw is as wide as the slugs in a PAF. I'll have to think of a good test to perform with some disposable humbuckers to get more clarity.
|
|


