|
|
Post by ms on Feb 5, 2023 11:22:31 GMT -5
What I want is an independent method of measuring changes in frequency, that is, decreasing inductance and increasing resistance as a result of eddy currents. Results from the new method are not what I expected, but first let's look at how it works, and then the results later. The top panel of the figure below shows my normal method of measuring impedance. An ac voltage source drives the series combination of the pickup and a sense resistor (about 1K). Input 1 (to the recording interface) measures the voltage across this series combination, and input 2 measures the voltage across the sensing resistor, which gives the current. The ratio is the impedance through the series combination. A simplified model of a pickup is drawn inside the pickup box. In order to examine the details of L and R, it is necessary to "unparallel" the impedance of the C. This works fine, but it would be nice to have a method which removes the effect of the C in a different way. 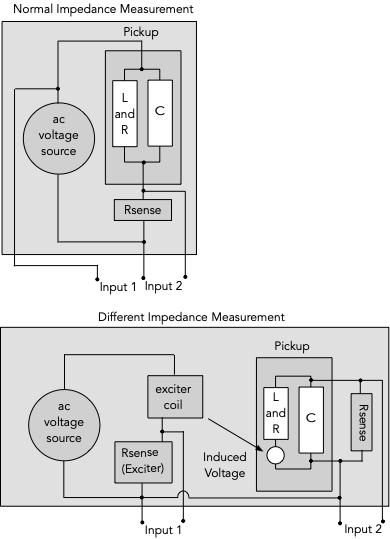
The bottom panel of the figure shows such a different method. An exciter coil is used to induce a voltage in the pickup coil. The voltage is induced around each turn, but of course using Thevenin's theorem, this becomes a single series voltage source. The exciter coil has an Rsense (165 ohms, value not critical, but needs to be known). The exciter coil is as described by Ken Wiltmont. Using the sense resistor is the easiest way to get accurate current information, both amplitude and phase. As usual, input 1 is used as a reference in a cross-spectral measurement with input 2. Rsense (input 2) is about 1K. This is small enough so that the input C of the recording interface and the C of the pickup have little effect. If we knew the value of that little voltage source, we would have a simple impedance measurement, similar to above. However, only the L and R would matter. Actually we only know the voltage to within a constant, and a 90 degree phase shift from the differentiation of the law of magnetic induction. The constant can be found by a calibration at low frequencies, where R can be measured by an ohm meter and the impedance of L is small. So that is a simple view of how it works; results later. |
|
|
|
Post by ms on Feb 5, 2023 12:25:00 GMT -5
Shown below is a measurement made with the alternate geometry shown in the lower panel from the previous post. The most striking difference between it and the "normal" measurement (shown further down) is that the imaginary part (the inductive reactance) does not bend over, but stays straight, up to the frequency where the measurement goes bad. Also the real (resistive) part is not as large. Why?   |
|
|
|
Post by aquin43 on Feb 6, 2023 4:51:20 GMT -5
I think that the reason for the disagreement with the other measurement method is a phase problem at higher frequencies. The calculation assumes that the induced voltage leads the current through the exciter by 90 degrees. The field seen by the coil, however, is the combination of the exciter field and the re-radiated field of the pickup losses. The phase of this combined field lags behind the assumed 90 degree lead so that when you calculate the impedance it appears more inductive than it should be. This phase error in the calculation rotates part of the resistive component into the inductive.
|
|
|
|
Post by ms on Feb 6, 2023 7:19:53 GMT -5
I think that the reason for the disagreement with the other measurement method is a phase problem at higher frequencies. The calculation assumes that the induced voltage leads the current through the exciter by 90 degrees. The field seen by the coil, however, is the combination of the exciter field and the re-radiated field of the pickup losses. The phase of this combined field lags behind the assumed 90 degree lead so that when you calculate the impedance it appears more inductive than it should be. This phase error in the calculation rotates part of the resistive component into the inductive.
I think you are saying that there are differences in the eddy current losses between the two different methods of excitation. Maybe it works like this: when you excite by putting a voltage across the coil, eddy currents are induced in metal pieces by the B field made by the resulting current in the coil. When excite with a B field, eddy currents are also induced in the metal pieces directly by this field. I think that this has consequences for analyzing what the field from the vibrating string does. There are a couple of ways to proceed experimentally. First, increase the eddy current losses by using a cover. I have some brass covers on order, but it appears that they are coming from China; I did not realize this when I made the order. Also, I have a higher loss pickup (Filter'tron, or however that should be written) that I have started to measure. |
|
|
|
Post by aquin43 on Feb 6, 2023 8:26:27 GMT -5
What I am really saying is that you can't get a known direct access to the pickup coil via magnetic excitation. There will always be a unknown filtering effect in play that will upset the phase relationship. Imagine that you went in via the shaded pole of my pole shading scheme. The coil excitation phase at high frequencies would be well below from the assumed 90 degrees lead. Phase shift is the real killer when making impedance measurements.
|
|
|
|
Post by ms on Feb 6, 2023 13:17:21 GMT -5
But it is not just that "it appears more inductive than it should be"; its inductive reactance at all frequencies is that of the low frequency inductance of the normal method (straight line on log log scale where the measurement is good). Here is the Fitler'tron with the new method:  and the original method: 
The inductive reactance at all frequencies is also that expected from the low frequency inductance of the normal measurement. The real part is even more reduced than that of the SDSH1N, approaching the low frequency value. |
|
|
|
Post by aquin43 on Feb 7, 2023 8:50:44 GMT -5
I haven't done the algebra on this but I did try a spice simulation with a single mutually coupled loss. Assuming that 1/imag(short_circuit_current) represents the inductive reactance it does seem that the effective inductance is constant at high frequencies with or without the coupled loss. The loss R/L frequency is 820Hz.

Version 4
SHEET 1 1636 1172
WIRE 480 -304 320 -304
WIRE 688 -304 560 -304
WIRE 176 -256 -192 -256
WIRE 320 -176 320 -304
WIRE 464 -176 320 -176
WIRE 688 -176 688 -304
WIRE 688 -176 544 -176
WIRE 176 -144 176 -256
WIRE -192 -128 -192 -256
WIRE 688 -128 688 -176
WIRE 464 -32 320 -32
WIRE 656 -32 544 -32
WIRE 848 -32 736 -32
WIRE 944 -32 848 -32
WIRE 1056 -32 944 -32
WIRE -192 80 -192 -48
WIRE 176 80 176 -64
WIRE 176 80 -192 80
WIRE 848 96 848 -32
WIRE 944 96 944 -32
WIRE 1056 96 1056 -32
WIRE -192 112 -192 80
WIRE 320 304 320 -32
WIRE 848 304 848 176
WIRE 848 304 320 304
WIRE 944 304 944 176
WIRE 944 304 848 304
WIRE 1056 304 1056 160
WIRE 1056 304 944 304
WIRE 320 336 320 304
WIRE 672 512 544 512
WIRE 160 560 -208 560
WIRE 304 640 304 512
WIRE 448 640 304 640
WIRE 672 640 672 512
WIRE 672 640 528 640
WIRE 160 672 160 560
WIRE -208 688 -208 560
WIRE 672 688 672 640
WIRE 448 784 304 784
WIRE 640 784 528 784
WIRE 832 784 720 784
WIRE 928 784 832 784
WIRE 1040 784 928 784
WIRE -208 896 -208 768
WIRE 160 896 160 752
WIRE 160 896 -208 896
WIRE 832 912 832 784
WIRE 928 912 928 784
WIRE 1040 912 1040 784
WIRE -208 928 -208 896
WIRE 304 1120 304 784
WIRE 832 1120 832 992
WIRE 832 1120 304 1120
WIRE 928 1120 928 992
WIRE 928 1120 832 1120
WIRE 1040 1120 1040 976
WIRE 1040 1120 928 1120
WIRE 304 1152 304 1120
FLAG -192 112 0
FLAG 320 336 0
FLAG 688 -128 0
FLAG -208 928 0
FLAG 304 1152 0
FLAG 672 688 0
SYMBOL ind2 448 -16 R270
WINDOW 0 32 56 VTop 2
WINDOW 3 5 56 VBottom 2
SYMATTR InstName Lpu
SYMATTR Value 2.6
SYMATTR Type ind
SYMBOL cap 1040 96 R0
SYMATTR InstName C1
SYMATTR Value 500p
SYMBOL current 848 176 R180
WINDOW 0 24 80 Left 2
WINDOW 3 24 0 Left 2
WINDOW 123 24 -28 Left 2
WINDOW 39 0 0 Left 0
SYMATTR InstName I1
SYMATTR Value ""
SYMATTR Value2 AC 0
SYMBOL res 752 -48 R90
WINDOW 0 0 56 VBottom 2
WINDOW 3 32 56 VTop 2
SYMATTR InstName R1
SYMATTR Value 7k
SYMBOL res 464 -288 R270
WINDOW 0 32 56 VTop 2
WINDOW 3 0 56 VBottom 2
SYMATTR InstName R3
SYMATTR Value 13k4
SYMBOL ind2 448 -160 R270
WINDOW 0 32 56 VTop 2
WINDOW 3 5 56 VBottom 2
SYMATTR InstName Leddy
SYMATTR Value 2.6
SYMATTR Type ind
SYMBOL ind2 160 -48 M180
WINDOW 0 36 80 Left 2
WINDOW 3 36 40 Left 2
SYMATTR InstName Lstr
SYMATTR Value 1m
SYMATTR Type ind
SYMBOL current -192 -48 R180
WINDOW 0 24 80 Left 2
WINDOW 3 24 0 Left 2
WINDOW 123 24 -28 Left 2
WINDOW 39 0 0 Left 0
SYMATTR InstName I2
SYMATTR Value ""
SYMATTR Value2 AC 1
SYMBOL res 928 80 R0
SYMATTR InstName R4
SYMATTR Value 1
SYMBOL ind2 432 800 R270
WINDOW 0 32 56 VTop 2
WINDOW 3 5 56 VBottom 2
SYMATTR InstName Lpu1
SYMATTR Value 2.6
SYMATTR Type ind
SYMBOL cap 1024 912 R0
SYMATTR InstName C2
SYMATTR Value 500p
SYMBOL current 832 992 R180
WINDOW 0 24 80 Left 2
WINDOW 3 24 0 Left 2
WINDOW 123 24 -28 Left 2
WINDOW 39 0 0 Left 0
SYMATTR InstName I3
SYMATTR Value ""
SYMATTR Value2 AC 0
SYMBOL res 736 768 R90
WINDOW 0 0 56 VBottom 2
WINDOW 3 32 56 VTop 2
SYMATTR InstName R2
SYMATTR Value 7k
SYMBOL res 448 528 R270
WINDOW 0 32 56 VTop 2
WINDOW 3 0 56 VBottom 2
SYMATTR InstName R5
SYMATTR Value 13k4
SYMBOL ind2 432 656 R270
WINDOW 0 32 56 VTop 2
WINDOW 3 5 56 VBottom 2
SYMATTR InstName Leddy1
SYMATTR Value 2.6
SYMATTR Type ind
SYMBOL ind2 144 768 M180
WINDOW 0 36 80 Left 2
WINDOW 3 36 40 Left 2
SYMATTR InstName Lstr1
SYMATTR Value 1m
SYMATTR Type ind
SYMBOL current -208 768 R180
WINDOW 0 24 80 Left 2
WINDOW 3 24 0 Left 2
WINDOW 123 24 -28 Left 2
WINDOW 39 0 0 Left 0
SYMATTR InstName I4
SYMATTR Value ""
SYMATTR Value2 AC 1
SYMBOL res 912 896 R0
SYMATTR InstName R6
SYMATTR Value 1
TEXT 944 -288 Left 2 !.ac lin 200 80 40k
TEXT -32 -336 Left 2 !Kstr-eddy Lstr Leddy 0.2
TEXT 584 -336 Left 2 !Keddy-coil Lpu Leddy 0.4
TEXT 24 176 Left 2 !Kstr-coil Lstr Lpu 0.3
TEXT -48 480 Left 2 !Kstr1-eddy Lstr1 Leddy1 0.2
TEXT 568 480 Left 2 !Keddy1-coil Lpu1 Leddy1 0.4
TEXT 8 992 Left 2 !Kstr1-coil Lstr1 Lpu1 0.3
|
|
|
|
Post by ms on Feb 8, 2023 6:52:22 GMT -5
I was hoping you would do a simulation. Thanks. Circuits using mutually coupled inductors, especially when more than one k is involved, are difficult to understand. The skin effect, creating variable frequency resistors, makes more complication. Here we have a circuit where an aspect of the response is simple. It ought to be good for something.
|
|


