dylanhunt
Meter Reader 1st Class
 I'm not this kind of doctor...
Posts: 67
Likes: 3
|
Post by dylanhunt on Jul 24, 2023 16:09:00 GMT -5
Has anyone measured Q values for a pickup at different frequencies? What would this tell you about the pickup, do you think?
I've measured several pickups at 100Hz intervals from 100Hz to over 8KHz, though after 5kHz (for single-coil pickups; around 3KHz, for humbuckers), I skip some of the intervals. Here's a graph of the result for a sample:
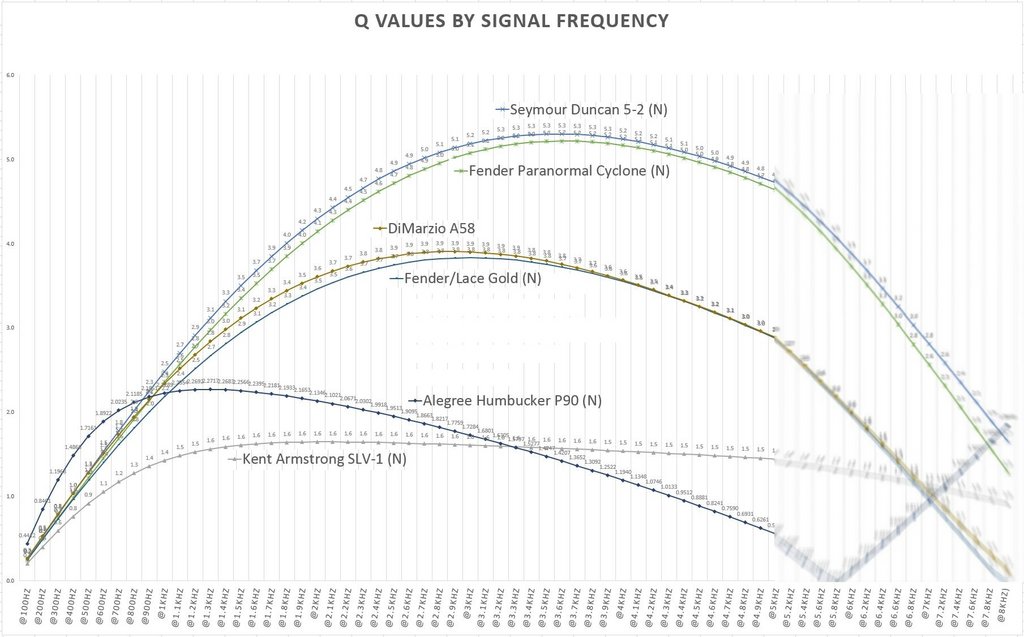
I've blurred the post-5KHz curves because the slopes are misleading if you don't recall that the intervals are 200Hz or 500Hz instead of 100Hz.
|
|
|
|
Post by ms on Jul 24, 2023 20:01:42 GMT -5
you expect the Q of an inductor to rise with frequency: Q = 2*pi*f*L/R. For a pickup with metal cores you expect it to drop with further increases as the losses increase (that is, series R drops), resulting from eddy currents.
|
|
|
|
Post by Yogi B on Jul 25, 2023 0:14:12 GMT -5
Has anyone measured Q values for a pickup at different frequencies? What would this tell you about the pickup, do you think? Measurements of a pickup's impedance that include phase information can be used to calculate Q in the same manner as a typical meter, i.e. by using Q = abs(tan(phase(Z))) = abs(Im(Z)/Re(Z)). In the spur of the moment, the example that comes to mind is aquin43's measurement of a PAF-ish DiMarzio from this thread. Below is a plot of the Q calculated from that data: first on a horizontal log scale up to 30kHz; then truncated to a 9.1kHz linear scale (in order to give something similar to the scale of your graph, and a curve somewhat resembling the P-90).
you expect the Q of an inductor to rise with frequency: Q = 2*pi*f*L/R. For a pickup with metal cores you expect it to drop with further increases as the losses increase (that is, series R drops), resulting from eddy currents. Adding in a parallel capacitance to get the basic three part pickup model, we get: Q = \left\lvert\frac{2 \pi f}{R} \Big(L - 4 \pi^2 f^2 L^2 C - R^2 C\Big)\right\rvertThe problem is that near the resonant frequency L & C cancel leaving a purely resistive impedance and therefore both a phase and Q of zero. So, to get a sensible value for Q at resonance, you must change tack and can instead use the gradient of the phase: steeper = higher Q. |
|
|
|
Post by ms on Jul 25, 2023 6:45:55 GMT -5
*** In my post above, I should have said that the series R increases with increase in eddy current losses.
From the data above (and other measurements I am familiar with) single coil alnico core pickups have the highest Qs (leaving out ferrite cores from the discussion) in the few KHz range. But they also have higher C than humbuckers because humbuckers use two coils in series, lowering the C. Steel is more conductive than alnico; I think we have good evidence then that it is the eddy currents that dominate the Q in the important range around, say, 3 KHz, not the effect of the coil C. The effect of the C is still there, of course, and it should dominate as frequency increases since its effect increases faster than the effect of eddy current losses.
|
|
dylanhunt
Meter Reader 1st Class
I'm not this kind of doctor...
Posts: 67
Likes: 3
|
Post by dylanhunt on Jul 25, 2023 16:08:57 GMT -5
Thanks for your replies. I'm not sure they are what I had in mind (The replies tell me what the Q values mean by looking "upstream" from where I have arrived at, telling me how I got there.). I already have the Q values for different frequencies and understand that my desktop LCR meter is probably calculating those values from more basic sensor information (series resistance and series reactance). I was looking for a conclusion from those LCR readings (I'm looking "downstream" from the Q values), probably a qualitative conclusion, about what the likely psychoacoustic reality will be.
For example, I see the curves as yielding a kind of signature: They are reliable measurements and distinctive for each pickup measured (though, interestingly, the Seymour Duncan 5-2 and the "designed by Fender" Cyclone pickup signatures are nearly identical; as are the DiMarzio Area 58 pickup and the Lace Sensor Gold neck pickup). However, I can't tell, from an inductor point of view, in the context of a "neutral", amplified signal going through a speaker, whether that Q signature should be expected to lead to reliable conclusions about the sound you get from the pickup.
If two pickups have the same Q signature, can you expect them to sound the same in the same position of the same guitar (all else being equal, etc.)?
Similarly, are there things you can infer from a Q signature, based on the frequency of the peak, the slope in the lower frequencies, the slope in the higher frequencies, and so on, about how it will sound? Will differences in those areas tell you something about ow the pickup will sound?
Here are some more measurements for two-coil pickups:
Notice how the PRS 85/15-S pickup, which sounded bland and flat to me--with no character that you would call either sparkle/chime or warmth--continues to rise after it should have peaked, peaking in the higher mid/lower high frequencies, so that it has a profile that is the reverse of more typical humbucking pickups, which tend to rise dramatically in the low frequencies, with a Q signature that peaks in the vocal midrange frequencies, somewhere between 1.2k and 2.2k, and then has a gently decreasing slope.
|
|
dylanhunt
Meter Reader 1st Class
I'm not this kind of doctor...
Posts: 67
Likes: 3
|
Post by dylanhunt on Jul 25, 2023 16:24:16 GMT -5
Yogi: Did you mean a SD PhatCat bridge pickup, rather than a DiMarzio? If I'm right about the value of "Q signatures", then I think what the graph tells you is that Aquinas' Phat Cat (humbucker-sized P90) is a bridge pickup,
If I'm right about the value of "Q signatures", then I think what your graph tells you is that Aquinas' mid-80s DiMarzio PAF-style pickup is a bridge pickup, and that my Alex Green-built humbucker-sized P-90 for the neck would make a better bridge pickup than a neck pickup; obviously, my view of what a "good" bridge pickup is, is an opinion, but for any two people who share an opinion about how a pickup should sound, this view of Q signature is a useful opinion given the objective reliability of the Q measurements. Along those lines, in my opinion, a good bridge humbucker will have a Q-slope that starts to decline around 1.2-1.8kHz (even my bridge Lindy Fralin Twangmasters, peak and decline by 2kHz)--and have a profile somewhat like a sand dune (more immediate decline after peak), whereas a good neck humbucker has a profile more like a lop-sided loaf of bread, as seen from the end of the loaf (flatter peak). |
|
dylanhunt
Meter Reader 1st Class
I'm not this kind of doctor...
Posts: 67
Likes: 3
|
Post by dylanhunt on Jul 28, 2023 1:15:45 GMT -5
A third side-by-side double-coil profile: the Firebird signature. This is what I am calling the reverse of the bridge PAF (left-facing sand dune) profile. That is, the Firebird signature profile resembles a right-facing sandune: It has a more or less gently rising slope in the lower frequencies, peaking around 3kHz, with a more dramatic falling slope on the treble side (NOTE: In my graphs, the falling slope on the treble side is exaggerated because I am skipping intervals out of laziness, but the point still stands.). Humbuckers that use magnets in the coil (in contrast to traditional PAFs that have iron/steel cores) are more representative of this profile, though the PRS 85/15-S neck and bridge pickups lean in this direction, while falling outside the PAF signature, but falling short of the Firebird signature.

The Gibson '61, the Lollar El Rayo, and the D'Urbano Moonflower all fall into the normal PAF pattern, with the Gibson '61 conforming to a bridge pattern, the Moonflower neck pickup conforming to a neck PAF pattern, and the El Rayo sort of a hybrid of a bridge and a neck PAF pattern. However, the bridge PRS pickup, the Creamery humbucker-sized Firebird (neck) pickup, and the Lindy Fralin Sunbucker (neck) pickup do not fall into a PAF pattern at all. Instead, the latter--the Creamery humbucker-sized Firebird pickup and the Lindy Fralin Sunbucker (neck), in particular--are the reverse of a bridge PAF profile.
|
|
|
|
Post by ms on Jul 28, 2023 14:30:52 GMT -5
IMO, the two most important numbers are the location of the resonant peak in the frequency response and the Q of this resonance. I do not think that the Q is important far from the peak, but maybe this needs to be explored.
|
|
dylanhunt
Meter Reader 1st Class
I'm not this kind of doctor...
Posts: 67
Likes: 3
|
Post by dylanhunt on Jul 28, 2023 15:14:35 GMT -5
I agree, MS--that this needs to be explored. I started exploring this because my view was that the inductance is a very good indicator of the resonant peak, but that a resonant peak value is ONLY a snapshot of a pickup's behavior, even when you add Q value (for that peak frequency). Measuring Q values (as a measure of the pickup's potential for resonance) at various frequencies across the (eventually, once amplified and fed into a diaphragm) musical frequency range should give a better picture (a moving picture) of a pickup's behavior.
I might be wrong about what information these graphs are giving me, and there's a gray area where I'm drawing a somewhat arbitrary line between a general PAF profile and whatever the PRS 85/15-S is doing, and then another somewhat arbitary line from the latter to what I'm calling a Firebird profile, but I do seem to have identified Q signature patterns that correspond to what I hear as different types of pickups. I'm hoping someone will either tell me that and how I'm wrong about my general inference, or try to (dis)confirm the "empirical" conclusions. It's totally possible that my "theory" is off base AND that I'm drawing conclusions from too few data (especially for the Firebird type).
|
|
|
|
Post by Yogi B on Aug 4, 2023 3:43:29 GMT -5
I do not think that the Q is important far from the peak, but maybe this needs to be explored. The pickup I'd be most interested in seeing measured would be a Filtertron, (mini) Tri-Sonic, or similar: anything that we know (from the frequency response) typically exhibits a moderate peak (therefore reasonable Q at resonance) but also has a sizeable portion of the response subject to significant rolloff with much lower Q.
dylanhunt: something I also thought about is the fact that you're seemingly measuring the Q with the pickups essentially unloaded, and what this means for the Q measurements versus the actual unloaded pickup output, say if channelled directly into an onboard buffer with (very) high input impedance. For example, adding say a 22k resistor in series with the pickup under test would significantly lower the ratio of reactance to resistance and thus decrease the measured Q. Yet, this extra resistor should cause negligible difference in the signal input to (and thus output from) an onboard buffer. Alternatively, we might think about what would happen once a load is applied to a pair of pickups wherein the impedance of each is an exact multiple of the other (e.g. using two identical coils, at first connected in parallel, then in series). Unloaded we should see no difference in Q: both the resistance & reactance are scaled by the same amount — their ratio remains unchanged. However the smaller impedance of the parallel configuration means it is less affected (retains a higher Q) than the series configuration, if an equal load is applied to both. |
|
dylanhunt
Meter Reader 1st Class
I'm not this kind of doctor...
Posts: 67
Likes: 3
|
Post by dylanhunt on Aug 10, 2023 0:16:12 GMT -5
Yogi B.: I have a replica of the mid-1960s Burns' Tri-Sonic single-coil, built by Adrian Turner of Adeson, though it is installed (in the guitar that is my avatar). I'm not likely to remove the Tri-Sonic given the number of soldered connections is around 44 (but you would know that since I used your redesign of A. Roberts' scheme of the wiring -- guitarnuts2.proboards.com/post/87713/thread; see also guitarnuts2.proboards.com/post/101318/thread), but maybe measuring the guitar's jack output for one of the pickups will provide a ballpark value(?) even if the complexity of the wiring might give misleading results.
I had been wondering about the loaded/unloaded issue and was wondering what to do about that. To date, all measurement of the Q profile has been unloaded (pickup only and unconnected). I've struggled with building even the basic part of the apparatus used in the technique that seems to be the consensus one here at GN for measuring pickups, frequently used by antigua. Unfortunately, my oscilloscope skills are pretty poor and I haven't been able to reproduce the instructions for that technique, despite help from antigua. I need to get in touch with Digilent most likely. So, not even capable of producing the simple bode plot, I haven't gone on to add the reference load. Out of frustration, I wondered if this Q profile technique of mine might be effective because, as you pointed out Yogi ( guitarnuts2.proboards.com/post/109760/thread ), Q incorporates three of the variables that are used in the 3- (L-R-C), 4-, 5-, or 6-part models discussed in the thread you referred to in that post and other threads (though, to be forthright, I don't know what the variables are in the 6-part model and don't have a lot of intuitions about some concepts like reactance).
There's a lot in your reply, so I'll need to digest it and then see what I can come up with. It sounds like you're suggesting that, if I am going to use unconnected pickups, that I should channel the unloaded pickup output into an onboard buffer with (very) high input impedance and then measure it. I'm not sure if , by "onboard buffer with (very) high input impedance", you are referring to a component of one of the test apparatuses (e.g., what antigua typically uses to test pickups), or referring to a buffered pedal, or to something more novel.
|
|
|
|
Post by Yogi B on Aug 12, 2023 23:47:47 GMT -5
It sounds like you're suggesting that, if I am going to use unconnected pickups, that I should channel the unloaded pickup output into an onboard buffer with (very) high input impedance and then measure it. For measuring the Q? No. The output impedance of a buffer (ideally) has nothing to do with the impedance of the source signal. What I was getting at is that although the unloaded measurements give results based solely upon the pickups, to have Qs & resonant frequencies as high as those measured actually manifest in the output signal from a guitar, the pickups would need to be connected to an onboard buffer. And that is connected only/directly to said buffer — forgoing the common practice of adding a dummy load pre-buffer to approximate a more 'normal' (lower Q, lower resonance) response. So, if the goal is to directly infer how the pickups will sound under typical conditions, you/we should stand a better chance of doing so by including the typical loading (200kΩ & 470pF in parallel) when performing the Q measurements. The unloaded measurements would probably be most useful in the development of n-part models (used in combination with the DC resistance & loaded Q measurements). |
|
dylanhunt
Meter Reader 1st Class
I'm not this kind of doctor...
Posts: 67
Likes: 3
|
Post by dylanhunt on Aug 19, 2023 22:43:39 GMT -5
I might need that dumbed down. I understand you're suggesting that I make the conditions for measuring unconnected pickups more true to the actual conditions when they will be installed, but I'm having trouble trying to read back what you're saying.
Q: Should I channel the unloaded pickup output into an onboard buffer with (very) high input impedance and then measure it (For example, adding say a 22k resistor in series with the pickup under test)? A: For measuring the Q? No. The output impedance of a buffer (ideally) has nothing to do with the impedance of the source signal.
Later, you said the following: ...we should stand a better chance of [inferring how the pickups will sound under typical conditions] by including the typical loading (200kΩ & 470pF in parallel) when performing the Q measurements.
Since this post of mine isn't moving things forward, here's a new graph with the DiMarzio EJ Custom (Bridge) next to other pickups (also unloaded). The plot of the EJ Custom (Bridge) doesn't appear that odd next to single coils (in the left-side graph), but when placed alongside humbucker PAF pickups (in the right-side graph), the EJ Custom Bridge pickup somewhat resembles the profile of the PAF-sized Firebird Jamie made me (I am presuming this is the classic Firebird shape for Q profile; so, The Creamery HB Firebird is probably not odd for Firebird pickups.).
Unless the "slugs" are, in fact, short A5 rod magnets, it must be the pickup's low inductance and the low contribution of the wire (Antigua reported AWG 43/44 wire in this pickup model, with an 8.0 kOhm DCR) to the pickup's total inductance (2.0H) that results in the long, slower rise to a peak Q frequency of 3.6kHZ. Note (in the right-side graph) the Lindy Fralin Sunbucker (Neck) in grey and the Suhr Thornbucker (Neck) in blue, near the yellow HB Firebird (Neck), for contrasting profiles of PAF-type pickups with magnets in the core.
 |
|
|
|
Post by Yogi B on Aug 25, 2023 17:12:46 GMT -5
I might need that dumbed down. I understand you're suggesting that I make the conditions for measuring unconnected pickups more true to the actual conditions when they will be installed, but I'm having trouble trying to read back what you're saying. Q: Should I channel the unloaded pickup output into an onboard buffer with (very) high input impedance and then measure it (For example, adding say a 22k resistor in series with the pickup under test)? A: For measuring the Q? No. The output impedance of a buffer (ideally) has nothing to do with the impedance of the source signal. Later, you said the following: ...we should stand a better chance of [inferring how the pickups will sound under typical conditions] by including the typical loading (200kΩ & 470pF in parallel) when performing the Q measurements. As you note, my point was about matching the measurement to the installation conditions. Adding a dummy load when measuring Q is one such way: changing the measurement process to better reflect the typical installation. The alternative of adding an onboard buffer to the guitar in which the pickup is to be installed is technically another means to achieve that same specific goal, but from the other direction: adjusting the installation to match the unloaded measurements. That is, the reason I mentioned an onboard buffer was as the means you'd need to employ in order to hear the pickups in a completely unloaded state. For measuring Q, a buffer would be pointless. Either you'd measure Q between the pickup an the buffer, in which case you should obtain identical results to your current unloaded measurements (if the buffer itself loaded the pickups that would defeat its purpose to isolate the pickups from any significant loading). Otherwise, measuring Q at the buffer's output would instead be measuring the Q of the buffer's output impedance, not the pickup.
I don't disagree with this, the shallower gradient at lower frequencies where the gradient of Q (with respect to angular frequency) should be approximately the ratio of L/R. However, the contrasting shape you also mention is strongly influenced by your use of a linear(-ish) x-axis. I can't easily or accurately replot your existing graphs on a log scale, but if I could do so the initial rising slopes ought not to look as radically different. As an example, look at the following graphs. Both plot the same curves, but differ in that the first has shows frequency linearly whereas the second shows it logarithmically. In the first, we see disparate shapes with the blue trace being shallower & more drawn out than the red (plus, the 7kHz upper limit rather unhelpfully reinforces the visual disparity). However, whilst in the second graph the gradient at any single given frequency is still different between the two traces, it becomes much more obvious that the two are in fact just pitch shifted versions of each other (in this case, separated by around 10 semitones). Side note: away from the resonant 'peaks' (or from this perspective, resonant notches), the gradients are essentially equal in terms of dB/octave or dB/decade, as can be seen on a log-log graph. |
|
dylanhunt
Meter Reader 1st Class
I'm not this kind of doctor...
Posts: 67
Likes: 3
|
Post by dylanhunt on Aug 28, 2023 12:09:13 GMT -5
Yogi B: Your last post (not to mention previous posts) is yet another example of how valuable this forum is--to me, in particular, but for others too, I'm sure. I was just thinking about your point about representing my (linear) plots of Q values being translations of the sort of bode plots John Hewitt and Antigua have made (post #2 above, guitarnuts2.proboards.com/post/109760/thread), when a penny dropped. I have not yet been able to produce those conventional plots using my scope, though antigua did provide additional instructions. My graphs were a stop-gap measure until I learn the full technique to do that. At the same time, my plots seem to show more variation than the conventional bode plot, where those differences may or may not be significant.
I suddenly realized that, if you could translate the log-based graph you find typically on these pages into one of my linear graphs (plotting Q against frequency), then one should be able to translate my Q profiles into the conventional bode plot. While the making of my measurements of Q at various frequencies is pretty tedious (perhaps more so than what antigua routinely does), which means going from the other direction would be smarter than starting with Q measurements, it sounds like a conversion/translation technique might not be so simple anyway. You say: "I can't easily or accurately replot your existing graphs on a log scale", but maybe that is only because I haven't shared the data in tabular form (my attempt to obscure the parts of the curve where there are gaps in the data was silly, in retrospect, in that it left the curve visible and only obscured the numeric values). I am happy to share the data table if there is a convenient way of doing so. Maybe the conversion technique is as straightforward as rewriting the equation for Q. I am often confused about what the conventional bode plots are even plotting since the y-axis is almost never labeled.
That thought reminded me to check back in to see if anyone had replied to my last post. Tying things back to the points in your last post, you make the important point that two curves, when scaled linearly, can seem disparate, but the same two curves, when scaled log'ly, can show themselves to be pitch shifted versions of each other. There are two kinds of considerations here, but the central issue is probably that of identifying the scope of significance within the 20Hz - 20kHz range of the x-axis and the range of the typical values of Q (0 - 6) on the y-axis. I'll continue that thought in a second-part post.
The immediate point seems to me to be that you have given me homework: Will log transforms of my data in my earlier posts on this thread show pickups that look identical except for pitch-points? I wouldn't think so, given that there appear to be three different types of shapes. That simplifies things as I can use pretty coarse-scale data to represent three types of curves linearly and log'ly.
|
|
dylanhunt
Meter Reader 1st Class
I'm not this kind of doctor...
Posts: 67
Likes: 3
|
Post by dylanhunt on Aug 28, 2023 16:15:09 GMT -5
More of a reply to YogiB... The central issue in looking at this linear vs log question is that of identifying the scope of significance within the 20Hz - 20kHz range of the horizontal x-axis and the range of the typical values of Q (0 - 6) on the vertical y-axis, when looking at my Q profiles.
For sake of contrast with my plot of the DiMarzio EJ Custom neck above, here is antigua's bode plot for the DiMarzio EJ Custom pickups (https://guitarnuts2.proboards.com/thread/7780/dimarzio-ej-custom-analysis-review):

One of the two considerations (alluded to above) is the psychophysics involved in this kind of measurement. The work of Weber, Fechner, and others suggests that a log scale is more revealing than a linear scale in identifying meaningful differences in the (visual, auditory, tactile) sensations of human subjects (https://music.arts.uci.edu/dobrian/maxcookbook/linear-frequency-vs-linear-pitch). For example, if you lift a 5-pound weight, then add an ounce to it, and another, and so on until you can finally tell the difference between the new weight and the starting 5-pound weight, this just noticeable difference will be different from the just noticeable difference for a 10-pound weight starting point, which will be different from the just noticeable difference for a 20-pound weight starting point. The just noticeable difference will be somewhere around 7 ounces for the 5lb. starting point, 14 ounces for the 10lb. starting point, and 28 ounces for the 20lb. starting point. The question is whether and how psychophysics (and psychometrics) wil play into the use of Q measurements at different frequencies to evaluate guitar pickups.
A prior consideration (a point you made) is that shape changes with scale, such that any interpretation based on a "profile" that has an essential shape will be dependent on any change in scale. When moving from humbuckers to single coil pickups, the measurement area--even keeping to a linear scale--will change simply because the Q values are greater (higher vertical y-axis) and the higher frequencies are more important (longer horizontal x-axis).
Another consideration has to do with the information that can be gleaned and is being used in interpretations of graphs, whether log-scaled or linear. The continuum of 20Hz - 20kHz appears to be the sort of thing you can measure (we do measure it) and we know certain things about the frequency math of music (halving or doubling the frequency makes a difference of an octave) that lead us to think that this "continuum" should be thought of as a log scale, rather than a linear scale. I would argue that in terms of detecting/discriminating the thresholds for "where" any guitarist likes their pickup's lows, mids, lower highs, upper highs "to be" at we are not interpreting sounds as something that is continuous and quantitative, but something that is discontinuous and qualitative. For such purposes, we interpret auditory sensations in contrasts and comparisons. We're really talking about different regions of the 20Hz-20kHz range, rather than a continuum. As a practical example, if you want prominent mid-range tones, then you want the highs and especially the deep lows to offer less competition for our ears.
When talking about the qualitative regions of tone (although this is subjective to the extent it is an intersubjective area where people communicate effectively about perceptions they individually have), we can objectify each zone as a specific range of frequencies that discretely--not continuously--relate to each other. In the context of guitar, and vocal performance too, people talk about things as having a three- to five-band frequency terrain: lows, low mids, proper mids, upper mids, proper highs. These correspond (roughly) to the 50Hz-400Hz, 300Hz-900Hz, 800Hz-2kHz, 1.8kHz-4kHz, 4kHz-8kHz frequencies respectively (more or less). When looking at different zones of the Q profile curve--using Q profiles in this discrete way--a linear transform is more effective because it accentuates differences in shape (and can be reliable as long as everything else remains the same during comparisons). In that case, if Q profiles measure something meaningful in the way I am using Q profiles, then it would make more sense to plot Q profiles on a linear scale.
Another way of looking at this is that the conventional bode plots are largely used in a confirmatory way: to confirm or provide an answer about something we already suspect, perhaps based on the inductance value. This allows us to look at a very small number of specific values (e.g., resonant frequency peak). By contrast, the Q profile is being used in an exploratory way: to tell us something that allows us to ask better questions. For exploratory purposes, the relationship of regions on a graph (and, therefore, the shape of a curve) becomes more important than the location of peaks; and, in this case, a linear scale accentuates differences in shape, whereas a log scale masks those differences (The point about the exploratory value of the shape of the curve could be misleading if the shape is merely an artifact of the transform, or if the psychophysics dictate that the data should be represented log'ly, rather than linearly.).
|
|
|
|
Post by ms on Aug 29, 2023 6:42:19 GMT -5
When we plot the frequency response of some system, it seems to me that it is helpful for resonances of different frequencies to have the same shape if they have the same Q. Since Q is related to center frequency over frequency width, a log scale meets the condition.
|
|
dylanhunt
Meter Reader 1st Class
I'm not this kind of doctor...
Posts: 67
Likes: 3
|
Post by dylanhunt on Aug 29, 2023 10:23:45 GMT -5
Thanks ms. Would you be willing to unpack that a little bit?
Added [9/1/23]:
What do you mean by "helpful"? What do you mean by "resonances of different frequencies" in this context? What do you mean by "resonances of different frequencies... [that] have the same Q"?
|
|


