guitarmd
Rookie Solder Flinger

Posts: 15
Likes: 4
|
Post by guitarmd on Nov 12, 2022 12:30:24 GMT -5
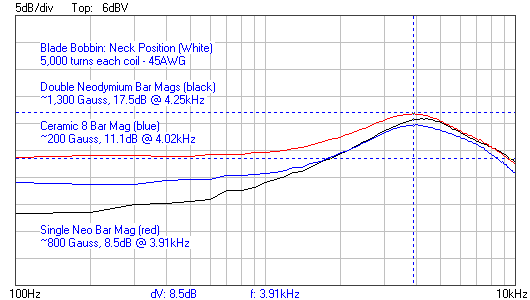
Question: Are bode plots similar to EQ curves? This would make a lot of sense to me, especially considering an interesting experiment I did the other day: testing some blade humbuckers I made with different magnets.
1x Ceramic 8 magnet, 2x Ceramic 8 magnets, 1x Neo bar magnet, 2x Neo bar magnets, and 1x A5 bar magnet.
 All have a near identical resonant frequency, but the 'EQ curves' are distinctly different for each magnet arrangement.
There are some contradictions, however, as on one blade humbucker there was a much more drastic difference between the Ceramic 8 and Single Neo magnets, while on the other blade humbucker the difference between the two was *almost* nonexistent.
Thoughts? I plan on doing something much more organized and controlled, but this has had me scratching my head a bit. Apologies for the lack of organization/structure, did this quickly the other day for a friend who stopped by to pick those pickups up (try saying that three times fast), as I told him that he could swap out the bar magnets if he wanted, to alter the tone -- so I was curious to see what alterations that might actually create. Unfortunately I didn't throw them on my LCR meter to compare the inductance from magnet to magnet.
|
|
|
|
Post by stratotarts on Nov 12, 2022 14:57:16 GMT -5
The problem with this, is that you haven't explained how you obtained the "EQ curves". Also it's not perfectly clear whether each or both curves are EQ curves or Bode plots.
|
|
guitarmd
Rookie Solder Flinger
Posts: 15
Likes: 4
|
Post by guitarmd on Nov 12, 2022 19:16:25 GMT -5
All of them are bode plots. Made with a Ken Willmott Integrator and a USB Oscilloscope + Vellemann software. I used an exciter coil attached to a signal generator on top of the pickups I tested, and the results are all bode plots made at 100Hz intervals, up to 10kHz.
My question is pertaining to interpreting said bode plots. "EQ curve" was the wrong terminology here. What I'm looking for is an explanation for the lower frequency range response varying significantly between all three examples, and what it would actually mean in practice, tone-wise.
I've mostly just paid attention to the resonant frequency and resonant peak. Just that one little point on the plot. Again, "EQ curve" was regrettably the wrong terminology. What I meant was "the entire bode plot" as opposed to just the peak, and how to compare/interpret discrepancies between two test subjects that occur in the area *before* the resonant peak.
|
|
|
|
Post by aquin43 on Nov 13, 2022 5:00:26 GMT -5
The bode plots are frequency response curves which are functionally the same thing as "EQ" curves except that EQ curves are made deliberately with tone controls. A useful thing to do with pickup bode plots is to normalise them at some frequency so that the variation in shape can be more easily appreciated. 1kHz is the reference frequency usually chosen for tone control curves. Setting your first set of curves to 0dB at 1khz would show how, to the ear, they all emphasise the 3kHz range while one would also seem to dip the bass. The same results could be obtained from a pickup with a flat response and a graphic eq.
|
|
guitarmd
Rookie Solder Flinger
Posts: 15
Likes: 4
|
Post by guitarmd on Nov 13, 2022 20:33:28 GMT -5
Thanks for the reply! That's what I figured -- that bode plots are effectively EQ curves, just wanted to be sure I was accurate in making that statement.
I'm unclear about what you mean about normalizing them at a frequency. What does that mean? I'm only familiar with selecting the test frequency intervals (e.g. 100Hz) and the test frequency range (e.g. 10kHz), and when I test a series of pickups I simply leave the settings exactly the same for each test.
|
|
|
|
Post by aquin43 on Nov 14, 2022 3:20:30 GMT -5
In this context normalising just means moving the curves up and down the dB scale to all coincide at a particular frequency so that the relative shapes of the curves can be more easily compared. I suggested 1kHz, for comparison as tone curves but 100 Hz would be a better choice for pickup curves generally. This is because all passive pickups except Alumitones are low pass filters and the only true common reference point they have is at a low frequency. Whether your software can do this I don't know. I use a different type of measuring system, first suggested here by ms, which is dedicated to pickup measurement and does this normalisation automatically. The overall sensitivity of the pickup can't really be measured by an exciter system and is less important than the frequency response unless you are trying to make a pickup that can overload a valve preamp input.
|
|
|
|
Post by stratotarts on Nov 14, 2022 8:32:16 GMT -5
What I'm looking for is an explanation for the lower frequency range response varying significantly between all three examples, and what it would actually mean in practice, tone-wise. That range is dependent mostly on the efficiency (output) of the pickup. But that is not a dependable measurement unless you carefully maintain the same dimensional characteristics of the test setup when testing multiple pickups. If you test the same pickup each time, you will see that the ~100Hz amplitude never changes more than tiny fractions of a dB, for any load changes that are non-resistive. If you are comparing different pickups with different output, it will raise or lower the ~100Hz base line, and also the entire curve. In some sense, the output is not a tone parameter (for example if you set all the sliders on a multiband eq up 3db, it's still "flat"). A lot depends on how you interpret your data. Certainly it is important to know whether the comparisons are of an absolute level, or "normalized" to consider the tonal response.
Often when I am comparing pickups with different output, I manually normalize the plots so they overlap at ~100Hz, just so the tonal differences are easier to view. An absolute, or non-normalized plot may be useful, but it is important to decide what meaningful direction the interpretation should take. Also, if there was a between pickup test setup change, it should be regarded as uncalibrated unless specific steps were taken to maintain minimal deviation in the test apparatus, and that deviation is itself known through calibration and experiment.
The main (possibly only) thing that output changes, is the way it exercises non-linear responses downstream, like effects boxes and amp inputs. Because, they may have non-linear response to inputs. However as both the guitar settings and input sensitivity and non-linear characteristics vary widely, it is difficult to predict the in situ effect of the loudness of a particular pickup. That is why I don't pay much attention to it, in the context of Bode plotting or tonal determination. I think, the output factors into the actual sound in a way that is a combination of output and tone, but the way those can be predicted is different and has different outcomes (for example depending on clean vs. dirty amp settings).
|
|
guitarmd
Rookie Solder Flinger
Posts: 15
Likes: 4
|
Post by guitarmd on Nov 14, 2022 12:43:50 GMT -5
What method and software do you use? And would you happen to remember the thread topic for that method? I'm extremely curious. I checked ms's profile and posted threads but could not find anything out. Would really love to elevate the accuracy of my measurements here as I think I have been making some interpretative mistakes. Very curious about how one would go about testing a pickup without the use of an exciter system. I'll have to redo my understanding here, as I've mistakenly been thinking I can interpret the relative output of a pickup simply by seeing where the plot starts. Higher start to a plot = higher output...well, apparently that was mistaken!
I don't have the ability to move the plots on this software, but I wonder if I could do so with another program. I'd imagine USB oscilloscopes are compatible with a wide range of softwares. Would love to know what other people are using.
I do think that not being able to normalize the plots by dragging them to the same frequency baseline is complicating things for me. What software do you use? I'm using a Velleman PCSGU250, which has its own proprietary software, but I'm thinking I might be able to use different software with it. Both you and aquin mentioned moving the plots to normalize them and I would love to use some software that I could do that with. I can imagine the utility this would have for comparing pickups, and as I'm winding pickups regularly and always testing out new designs, it would be extremely useful.
As mentioned above: is my interpretation that a higher start to a plot = higher output incorrect? Here's an example:
 I couldn't imagine why the Strat single would start so much higher, with both a lower inductance and a lower Gauss. That really threw me off, which is why I stopped the plot. Anyway, that aside:
That would mean the Strat single coil was about 19.8dBV more output than the others...that seems absurd, and makes me think that my entire interpretation of 'output' so far has been incorrect.
I do wish my software had a button I could click to automatically find the resonant frequency, as opposed to having to line up the X axis grid marker by eye. Sometimes the peak is rather flat and not very obvious and it can be very hard to tell where it is. Same goes for "dBV @ f" as an automatic function...would be much easier and faster *and* more accurate than lining up 3 grid markers by eye and hoping I got it "close enough." Normalizing all plots at 100Hz would certainly make the visual representation a *lot* clearer. At first I was confused by what you guys were talking about but it's making a lot more sense now. Much appreciated.
|
|
|
|
Post by stratotarts on Nov 14, 2022 16:41:05 GMT -5
Just a quick note for now - a 19.8dB difference is suspicious because the integrator has a 20dB gain switch on the panel. Is it possible you bumped it accidentally? Also to leave a thought with you that might steer you to the answer to several questions that you asked ... many people export the scope data as a .CSV file and then process it in some other software (like a spreadsheet). With that, you can program almost any plotting or analysis you can dream up.
|
|
|
|
Post by antigua on Nov 14, 2022 21:24:59 GMT -5
As a user of the Velleman, I can tell you that, unfortunately the only way to normalize the plots is the manually change the Vpp value in the main window so that the beginning of the plots line up as you see in the screen shot below. As is said above, you can make sure they intersect at 100Hz or 1kHz, but in most of my testing as you see below, the response is very flat, and so I don't have to be concerned about the specific low frequency they converge at, because they naturally overlap across all those frequencies everywhere the plot line is nearly perfectly horizontal. There is another way actually, slightly move the exciter coil closer or futher away from the pickup, and adjust until the lines overlap. You have to have the exciter coil suspended over the pickup in such a way that you can adjust the distance easily, though. My exciter is held up over the pickup with a clamp on an arm, so I can just adjust the height of the exciter in the clamp and the arm, but if you are just plopping the exciter over the pickup, you have to change the Vpp. In the screen shot below you can see I have it set to 1.84 Vpp, which was the particular voltage that allowed the plot of that test to overlap with the plot of the previous test.  . To be honest I can't picture in my head what your setup looks like, an actual picture is always good as it eliminates a lot of confusion about what is going on. As for the reason why your pickups require so much "calibration" in order to get them to match at the start of the bode plot, if you are using pickups with different types of pole pieces or rail bars, the magnetic coupling between those pickups will differ. The exciter coil transmits an electromagnetic field, and different pole pieces will receive a different proportion of magnetism depending on their geometry and how the exciter is positioned with respect to the pickup. As an example, when I put an exciter coil over a pickup with a cover, like a PAF with a cover or a Tele neck pickup, it will read a lower voltage than if the pickup has no cover on it, like a Tele bridge pickup, but not because they're weaker, but just because the cover causes the exciter coil to be slightly father away from the coil of the pickup, so I have to adjust the Vpp value in the software to give the different pickups the same baseline. Pickups with steel pole pieces or blades almost universally measure higher output than those with magnet cores (AlNiCo, ceramic) because the steel metal magnetically couples with the exciter coil to a higher degree than with AlNiCo or ceramic. |
|
|
|
Post by ms on Nov 15, 2022 10:19:27 GMT -5
|
|
guitarmd
Rookie Solder Flinger
Posts: 15
Likes: 4
|
Post by guitarmd on Nov 15, 2022 16:43:34 GMT -5
I'm kingvox from TDPRI -- my setup is the same as I've mentioned over there and the one I made the YouTube video about, with the Integrator and the Velleman + Velleman software. For anyone who hasn't seen my video, this is it here, and is the exact setup I'm using at the moment:
Good to see you! And if I'm not mistaken I think I know stratotarts too, just didn't recognize the username.
Anyway, I'm confused because I measured the rail pickups with the coil standing on its side inbetween them, as I do for all humbuckers, as you taught me -- but I can't imagine that would cause them to plot so much lower than the Strat pickup. That was very confusing. The rails and poles in both cases were uncovered, exciter coil just directly on top of them.
I may have to do another edit and re-release of that video as I mention near the end that you can compare output by comparing where the plot starts on one pickup vs. another, which is another reason I really want to get this right. I also wasn't aware of manually altering the Vpp to get the plots to line up. I make some wildly different pickups, and the plots can be quite far apart for that reason. I just was not expecting this at all in this case.
Do you know if the Velleman software can export the files as .CSV? I do see that is has "export data" and I've tried that before to no avail, just sent it into a text document with a bunch of numbers I didn't understand.
For clarity's sake, the Integrator was on the same settings for all tests, no switches changed to different positions or anything. I had it set to "Load" and the -20dB gain. The *only* thing I changed on the rail pickup test was the magnet -- the same exact coil was used, I just removed the ceramic 8 magnet and replaced it with a neo, re-tested, then did the same thing again while adding another neo. I did my absolute best to position the exciter coil in exactly the same position each time, as I did have to remove it in order to attach the new magnet each time.
I may try messing around with the Vpp to equalize them. I suppose if you have no idea where it'll plot you just have to take a guess, see where the plot starts, and keep guessing until it lands right over the previous plot?
Still trying to see if I can use other software with the Velleman.
I'm going to take a look at that program, thanks so much. |
|
|
|
Post by stratotarts on Nov 15, 2022 20:00:57 GMT -5
Anyway, I'm confused because I measured the rail pickups with the coil standing on its side inbetween them, as I do for all humbuckers, as you taught me -- but I can't imagine that would cause them to plot so much lower than the Strat pickup. That was very confusing. The rails and poles in both cases were uncovered, exciter coil just directly on top of them. Magnetic fields decay very rapidly as the distance from the source. You can check that with the magnetometer. There is a huge difference between the field intensity at the pole tops, and a point a few millimeters away from that. The time varying string field isn't the same field, but it follows the same general rule. So it's much more intense at the poles than slightly distant, just the same.
Yes, it's next to "save image". IIRC it doesn't say "CSV", it only mentions "data".
You could. It makes me a bit nervous because of the risk of clipping. Seems to me that would be an awkward trial and error process anyway. I now use a 4Vp-p drive because it gives me the best dynamic range. But I monitored the signals a lot to be sure that was safe. Testing at a fixed drive level, exporting and doing post processing would be preferable.
|
|
|
|
Post by antigua on Nov 15, 2022 22:26:54 GMT -5
Do you know if the Velleman software can export the files as .CSV? I do see that is has "export data" and I've tried that before to no avail, just sent it into a text document with a bunch of numbers I didn't understand.
For clarity's sake, the Integrator was on the same settings for all tests, no switches changed to different positions or anything. I had it set to "Load" and the -20dB gain. The *only* thing I changed on the rail pickup test was the magnet -- the same exact coil was used, I just removed the ceramic 8 magnet and replaced it with a neo, re-tested, then did the same thing again while adding another neo. I did my absolute best to position the exciter coil in exactly the same position each time, as I did have to remove it in order to attach the new magnet each time.
I may try messing around with the Vpp to equalize them. I suppose if you have no idea where it'll plot you just have to take a guess, see where the plot starts, and keep guessing until it lands right over the previous plot?
Still trying to see if I can use other software with the Velleman.
I'm going to take a look at that program, thanks so much. Yeah when you lay the exciter sideways the coupling between the exciter and pickup is weaker than when it's directly over the top. To do an apples to apples test, you'd have to have one exciter over both coils of the humbucker, in order to approximate the guitar string being magnetized through two different places, but even then. Another approach is to just have the exciter laying flat for both the humbucker and the single coil test, and in the case of the single coil, you offset the exciter from the single coil by half, as if the single coil under test was half of an imaginary humbucker, where the other half of this humbucker is open air. That should give a realistic comparison of voltage output, but it still might give a false sense of accuracy because such a small difference in placement of the exciter coil has such a big impact on the output voltage; it's error prone and no promises can be made unless your very meticulous with where everything is placed. With the Vpp it is trial and error, it usually takes about five tries. The Vpp adjuster is extremely precise, which is unexpected for a USB device that doesn't cost much money. Changing the Vpp from 1.83 to 1.84 makes a noticeable difference in the plot amplitude, so if I spend the time I can make very neat looking comparison plots. So if you're trying to do a comparison between different pickups with regard to amplitudes, and you take into account all the pitfalls of doing that test, then the Vpp should never change for the test, but if you just want to normalize the plots so that only the EQ curve differences can be easily compared, then you'd want to tweak the Vpp to get a nice overlap of the plots ahead of the resonance. |
|
|
|
Post by ms on Nov 16, 2022 5:53:35 GMT -5
Have you investigated exiting just one coil of a humbucker, or one coil at a time? Remember, the coils are in series, and so they should have very close to the same frequency response, but coupling between the coils could affect the results. How much? You could probably ignore the coupling at 100 Hz and get an output comparison between SC and HB at low frequencies.
|
|
|
|
Post by antigua on Nov 16, 2022 8:46:18 GMT -5
Have you investigated exiting just one coil of a humbucker, or one coil at a time? Remember, the coils are in series, and so they should have very close to the same frequency response, but coupling between the coils could affect the results. How much? You could probably ignore the coupling at 100 Hz and get an output comparison between SC and HB at low frequencies. I think you get a funky result when you put the exciter over just one coil, because rather than get a combined output of the two coils, you get the output of one coil, loaded by the other, which end up being a different response than when both coils are producing voltages simultaneously. |
|
|
|
Post by ms on Nov 16, 2022 10:44:04 GMT -5
Have you investigated exiting just one coil of a humbucker, or one coil at a time? Remember, the coils are in series, and so they should have very close to the same frequency response, but coupling between the coils could affect the results. How much? You could probably ignore the coupling at 100 Hz and get an output comparison between SC and HB at low frequencies. I think you get a funky result when you put the exciter over just one coil, because rather than get a combined output of the two coils, you get the output of one coil, loaded by the other, which end up being a different response than when both coils are producing voltages simultaneously. Consider the low frequency limit (about 100 Hz, say). The series circuit model consists of a single loop with a voltage source, the two coil resistances, and the load resistance. You measure the voltage across the load resistance. This is a very simple circuit. For example, you can rearrange the other three elements into a different order in the loop, and the measurement does not change. If you excite the coils one at a time and add the results, or excite them both at the same time (not changing the excitation amplitude) then you get the same answer. (That is, if you have two voltage sources in the loop you can add them to make a single voltage source.) |
|
|
|
Post by stratotarts on Nov 16, 2022 11:07:56 GMT -5
I agree, but this will give you a comparison between a SC and one coil of an HB, when only one coil is excited (the other one is weakly excited, however). I think you would have to consider the excitation of both coils if it is an output comparison that you are doing, since the string does excite both coils of an HB.
I can't help but wonder, though, what is the purpose of comparing them? Is it, for example, making matched sets of HB/SC for some guitar? It is already common knowledge that HB are louder as far as I know. A really meaningful comparison depends on a reasonably accurate measurement. To make that work would require an exciter test arrangement that can be confirmed by comparison with actual string driven measurements. Also in this case, that would accommodate diverse pickup types. It's possible but not very easy. The problem is not to make it work, but to determine the measurement error confidently.
|
|
|
|
Post by ms on Nov 16, 2022 13:05:22 GMT -5
I agree, but this will give you a comparison between a SC and one coil of an HB, when only one coil is excited (the other one is weakly excited, however). I think you would have to consider the excitation of both coils if it is an output comparison that you are doing, since the string does excite both coils of an HB.
I can't help but wonder, though, what is the purpose of comparing them? Is it, for example, making matched sets of HB/SC for some guitar? It is already common knowledge that HB are louder as far as I know. A really meaningful comparison depends on a reasonably accurate measurement. To make that work would require an exciter test arrangement that can be confirmed by comparison with actual string driven measurements. Also in this case, that would accommodate diverse pickup types. It's possible but not very easy. The problem is not to make it work, but to determine the measurement error confidently.
Measure one coil, and then the other. Add the voltages. To keep interactions down, I like small coils, a short cylinder with a diameter less than that of a pole piece. The coil is placed over a pole, of course. It is useful to measure relative low frequency output levels. Pickups with different frequency responses can be difficult to compare by listening. For example, if you have a resonance above 4 KHz, and lower it in steps by adding C, you might find that it gets louder sounding, presumably because the lower frequency resonance emphasizes harmonics that have higher output. |
|
|
|
Post by antigua on Nov 24, 2022 14:58:04 GMT -5
Here is what happens when you place an exciter over one coil of a humbucker. In both cases the resonance is around 7.7kHz. When the exciter is over the screw, the slope drops sharply at 13.5kHz, and then it becomes more gradual at 17.2kHz. I get the same "kink" on the capacitive side when measuring the humbucker "split" with the exciter in the "proper horizontal" arrangement, but it's probably rarely seen because I usually set the dB scale to 1dB per division for humbucker bode plots, so the kink is something that is specific to one coil.  Here's a bunch of plots where I've tried series and split, with the exciter over one coil or both, with the shielding disconnected, and I didn't label them because it's just a mess of overlapping lines, but I notice that the inductive part of the slopes tend to be consistent, and most of the variety is on the capacitive side, and disconnecting the shielding definitely causes interesting things to happen, where the coil and the pole pieces lose their capacitive relationship (or at least its' greatly reduced).  I think the three part model works really good for the inductive behavior and the primary L C resonance, but there are parasitic capacitances and inductances that exist in a PAF style humbucker whose resonances are of a higher frequency which are not accounted for by a simple model. It would be interesting to see how the model would have to be modified in order to match the curves, but I know for me that would involve a lot of trial and error.   I apologize for how ugly looking that exciter is in these pictures. I used 42 AWG wire and had to shrink some plastic around it to protect it. |
|
|
|
Post by ms on Nov 25, 2022 13:46:06 GMT -5
If the pickup has inductance L and capacitance C, then each coil has inductance L/2 and capacitance 2*C. If you excite one coil, then the other forms a voltage divider with the instrument load. It is a parallel resonance that has a high impedance at roughly twice the pickup resonant frequency. This causes a steep fall off in this frequency range. Details could be more complicated, considering other impedances in the circuit.
As you show, low frequencies are not affected, and so you can get the low frequency gain by measuring the coils separately and adding the voltages. So you can compare the level of an SC and a humbucker.
|
|
|
|
Post by aquin43 on Nov 26, 2022 9:52:16 GMT -5
Rough Spice simulation of a two coil pickup with one, the other and both coils driven. The cols have different losses as in the screw and stud coils of a humbucker. The "if" statements in the parameters E1 and E2 do the switching. The graph order is E1 brown, E2 red, E1+E2 orange.
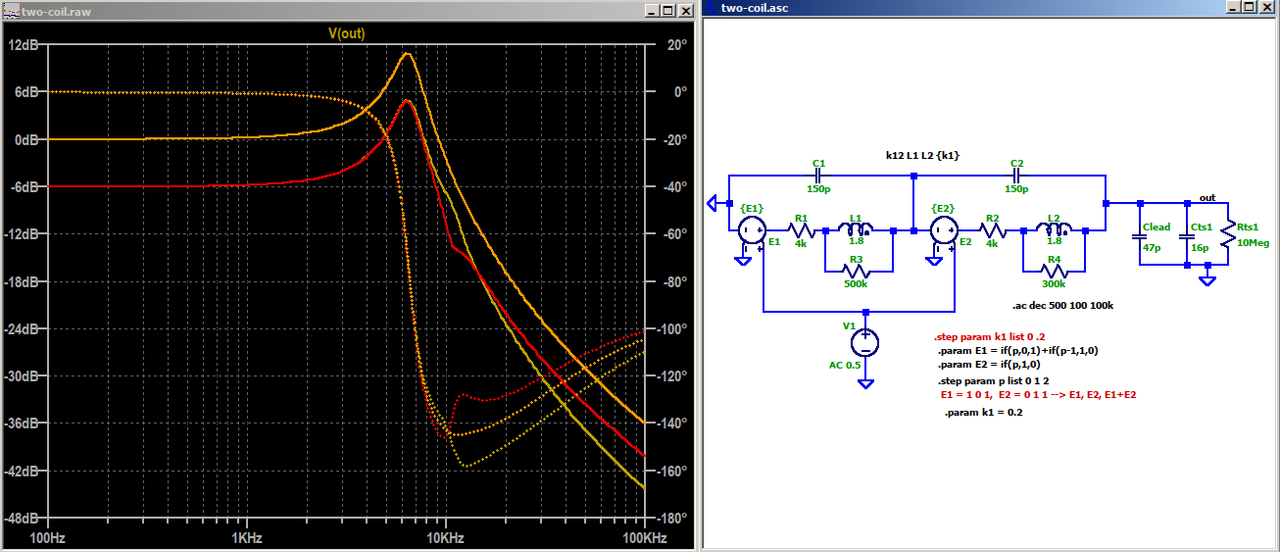
There is a theorem called superposition which, roughly speaking, states that in a linear system the sum of the responses to separate inputs is always the same as the response to those inputs applied simultaneously. So, the sum of the individual coil responses will add up to the whole response if - crucially - you can get the levels right.
|
|
|
|
Post by antigua on Nov 26, 2022 16:40:19 GMT -5
Thanks a lot for creating that spice simulation, that's next level analysis. It makes sense that the final output is the sum what the two coils produce independently.
Adding the voltages of the coils separately in order to compare to a single coil seems like it should work in theory, but in practice there's big ambiguity when you have staggered pole pieces and different thickness of bobbin preventing a consistent placement of the exciter over what is suppose to represent the "top" of the pickup, and a millimeter of difference alters the output by several dBV. The staggered Strat pickups in particular are a problem, where the tall pole pieces create a virtual "top" of the pickup that is a few millimeters further away from the coil than with a PAF type bobbin. All anyone can really say for sure is that PAF humbuckers tend to be a lot louder, 4dB to 5dB maybe, such that when you mix single coils and humbuckers in a single guitar, you have a big volume disparity between them.
Comparing two pickups of the same type works fine though, but in that cause you will find that it takes a lot of wire just squeeze out just a small amount of dB gain, so you end up with pickups like the SSL-3 or SSL-5 that have a ludicrous inductance compared to a typical Strat pickup just to try to get close to a PAF type pickup in terms of output, and you find that the mildly overwound single coils, like Texas Specials or (formerly known as) Lollar Blackface don't have any appreciable boost in gain, and that the only difference they offer is a tendency towards a lower resonant peak (given that a longer guitar cable could have lowered the resonant peak to a great degree all by itself).
A particularly valid comparison is the output of an AlNiCo vintate Strat pickup with a steel poled import Strat pickup, since the dimensions are very similar, and the main difference is the materials, and you see something like a 4dB gain from the replacement of AlNiCo with steel.
|
|
gpdb
Meter Reader 1st Class

Posts: 66
Likes: 5
|
Post by gpdb on Nov 27, 2022 12:43:05 GMT -5
guitarmd - As to your first question about "is it an EQ curve," I call it a resonance curve. This is simply because the curve is providing the resonance at each frequency, and it's the same data you would use to determine the resonant peak. Ergo, resonance curve. It's not a scientific term (as far as I'm aware), but it helps people understand it contextually better. If you check out my instagram (@guitarpickupdatabase), you'll see all the work I've been doing with these. As for lining up the charts, you can absolutely export the data from the Velleman software. You were correct, you just go to Export Data, and export the data as a .txt file. That will give you a file with 3 columns - Hz, Vrms, and dBV. The image that's generated by the Velleman software is dBV as the Y and Hz as the X. You can import this data to excel very easily and create your charts there. This is exactly what I do for all of mine. Open Excel and in the toolbar click Data > From Text/CSV. You can artificially raise or lower the dBV numbers just by adding a constant number to each. I do this sometimes to match the dBV of the resonant frequencies (or at 100hz) to make it more comparable. 
|
|
guitarmd
Rookie Solder Flinger
Posts: 15
Likes: 4
|
Post by guitarmd on Dec 2, 2022 21:00:58 GMT -5
Thanks so much. And thanks to everyone else. Wealth of information here. I'm currently experimenting with Excel to see if I can get all of that working! So much for me to think about. Going through all of these posts now.
|
|
guitarmd
Rookie Solder Flinger
Posts: 15
Likes: 4
|
Post by guitarmd on Dec 3, 2022 20:24:08 GMT -5
stratotarts My purpose is mainly for my own pickup designs. For example, 46AWG is not easy to come across, and if purchased here in the USA, is exorbitantly expensive, to the tune of 80 dollars or more per pound for poly coated wire.
So I've had some workarounds, including using taller bobbins and thinner wire, e.g. 44AWG. So the comparison tests are very useful for pickup building when trying to achieve similar (or as identical as possible) sonic results using different build designs. It's also going to be an interesting way to actually provide some data about what actually makes a difference with pickup winding variables.
My concern is mostly redoing some models of my pickups due to a lack of availability of parts, and concern that I won't be able to get them again in the future. So if I can achieve the same sonic character using different materials/aspects of the build, then mission accomplished.
I'm trying the normalizing the dBV now. Working beautifully. It took me a while to figure this out in Excel, even doing something as simple as adding or subtracting a number from an entire column -- but I got it. I also figured out you can simply click and drag the text file from the scope right into a spreadsheet and it'll automatically convert it, just have to cut and paste and reorganize things a bit, and good to go. I'm pretty much completely ignoring Vrms and only looking at Hz and dBV.
I normalize the pickups to the same dBV first by finding the difference in dBV at 100Hz, and adding or subtracting from one pickup or the other as necessary to get both the same -- then I subtract that dBV reading at 100Hz from both pickups, so both are 0 at 100Hz.
Much, much easier comparisons with 0 at 100Hz as a baseline. I was confused about what you guys meant in regards to this at first, but now I see it's quite simple.
And it's a huge help comparing some pickups I've made deliberately as test subjects, changing one variable at a time, such as wire gauge, or magnet type, or turn count, for very interesting comparisons to see what actually changes with these single variable changes per pickup. Averaging of course will be required for more accuracy, but I have wound plenty of pickups so that won't be an issue.
|
|