|
|
Post by JohnH on Feb 20, 2014 3:37:55 GMT -5
Tone Pots - including 'No-Load' pots
To go with the tone capacitor, the Tone Pot is the other component of a simple treble-cut tone control. The usual assumed knowledge is that we should use a higher pot value for a brighter tone, and that hotter pickups need higher value pots. Let's explore those issues.
From the discussion on tone caps, it's clear that the added brightness that we might want at maximum has little to do with the cap, and so both tone pot and volume pot values equally affect the brightest tone. Ignoring the cap, the two pots are in parallel, so two 250k pots equates effectively to 125k, two 500k or one 250k and a no-load is 250k, and a 250k and a 500 k is 167k (Rtotal = 1/(1/R1 + 1/R2))
Let’s look at the use of various pot pairs, Volume/Tone, starting with single coil pickups. Cap value is unimportant, but was modelled with 22nF.
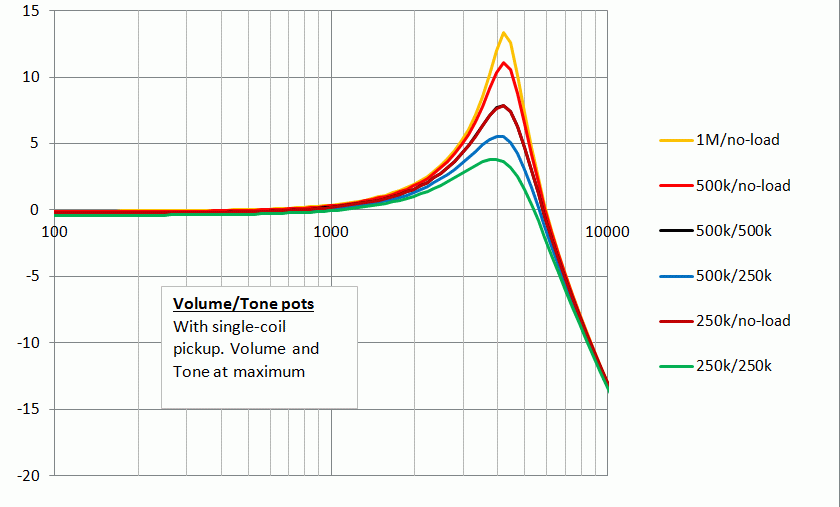
There's a distinct peak of about +4db even with 250k pots, and that can be increased by use of higher values or a no-load tone pot. An extreme case is a 1M volume pot and no tone pot, with a rather shrill +13db peak.
(As an aside, just a word on these graphs showing peaks etc: They are theoretical values based on a uniform frequency response input. So they would get modified by the real-world characteristics of a the guitar and pickup. But they are good for comparing results, ie, although we can’t tell the actual true response of a real pickup from these, a configuration with a higher peak will be likely to have more output at that frequency than one with a lower peak. Ok? Carry on....)
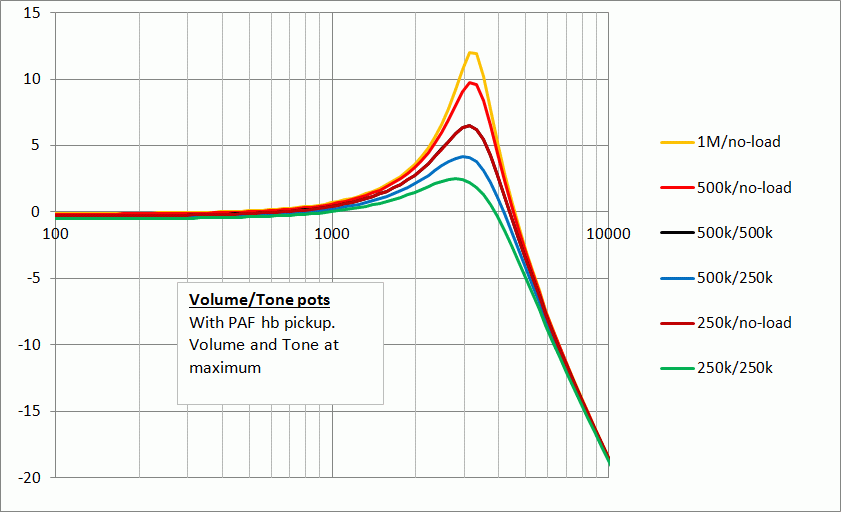
Moving to the vintage PAF humbucker, all the peaks are at lower frequency, and not as high. Hence if we want the same sort of peak to perk up the top end response, we need a higher value combination of pots. The two 500k’s look pretty good, and it's the same trace as a 250k with no-load pot.
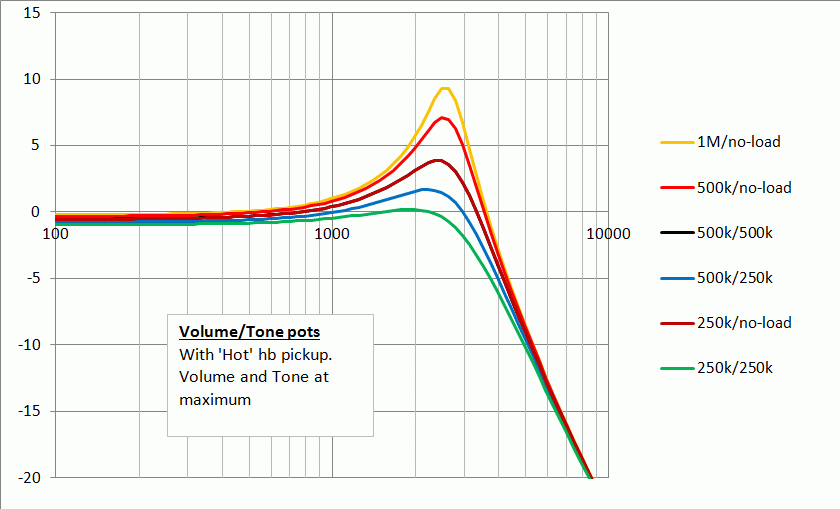
Now look at the results for the ‘hot’ humbucker. It’s deeper and duller again. One might think of a 500k volume and no-load tone for this one, subject to taste of course.
In the pursuit of maximum brightness, there are also some adverse factors that should be considered. The larger the tone pot value, the least effect there will be within the upper half of the turn, and the more the main tone-control action will be concentrated down below 5 or less.
And for the volume pot, the higher the value, the higher the impedance of the guitar is when it's at mid-volume and the more it is affected by treble loss from the cable. This can be compensated for with treble-bleed. Certainly this works well with 250k and 500k pots, and probably reasonably well with 1M pots (but this needs checking).
'No-Load' Pots
Fender also names these the 'Delta Tone' system. What for?
'No-load' pots have a break in the conductive track that goes to infinite resistance as you approach maximum. Below that they are almost the same as standard pots of the same value. That is how I have assumed them to be here. However, the two I bought from Fender had a more accurate max value around 250k than do many standard pots, which often read a bit low. Note that you can make your own no-load pots. It works very well particularly with full-sized 24mm pots.
But take another look at the graphs and see what they do. Typically, they are adding about 3db of brightness at the high treble peak. That is useful because it is a small but distinct increment, but not too much. So you may find the perfect tone at no load, or at max resistance just short of the 'no-load' break. The difference is usually notable but I find that it is not one that you would really need to split in two. (But later, we'll look at TBX pots which have a full range through this extra bright zone).
Also, while offering the max brightness of a very high value tone pot, it still has the smooth tonal transitions of the smaller pot value. Seems good to me!
|
|
|
|
Post by ux4484 on Feb 20, 2014 11:14:07 GMT -5
As I'm looking at the charts, I keep going back to the Single coil one, it's a nice representation of the ice pick to the head effect of a Stratocaster bridge pup.
|
|
|
|
Post by sumgai on Feb 20, 2014 15:43:52 GMT -5
ux,
Ya gotta remember, this is all dealing with nothing but the fundamental frequencies. As the harmonics are generated, they are lower in strength. Sadly, they, and their interplay with the fundamental, aren't shown in John's 5spice arrangements.
John, I wonder if you've set up 5spice to filter out any harmonics... or conversely, if the program does that by default, and you can somehow turn on the display of harmonics. Truly, that's be more informative to most players, or so I should think. Ideally, we should be seeing something akin to Don Tillman's interactive graph... you know the one I'm talking about, right?
sumgai
|
|
|
|
Post by ashcatlt on Feb 20, 2014 16:07:02 GMT -5
Pretty sure it's a step function, including all frequencies at equal strength. It's pretty much exactly the opposite of "just fundamentals" in that it is every harmonic of every note all at equal strengths. You get the exact same curves if you run white noise through the filter.
|
|
|
|
Post by JohnH on Feb 20, 2014 17:42:56 GMT -5
Pretty sure it's a step function, including all frequencies at equal strength. It's pretty much exactly the opposite of "just fundamentals" in that it is every harmonic of every note all at equal strengths. You get the exact same curves if you run white noise through the filter. Tbat's right. It knows notbing about guitars, harmonics or anything other than electrical characteristics of the pickup (approx and generic) , circuitry, cable and amp input. Its useful because it is very pure, just based on classical theory. Outputs need to be considered by comparison to each other. So if two traces look much the same, they will likely sound the same, and if one is lower at a given frequency band, it will sound less there. Such results aid understanding, and also help lead to good design decisions in the real world. For example, based on what has been posted so far, you can find out why, to add maximum brightness to a guitar, theres not much point in making the tone cap smaller, better to look at the pots. But i have some ideas about how to bring real guitar inputs into the considerations. More later.... |
|
|
|
Post by ashcatlt on Feb 20, 2014 20:34:03 GMT -5
ltSpice is a little heavier than the 5spice that is popular around here. Not quite as user friendly but quite a bit more powerful. One of the things it does is take a .wav input and output a .wav. It's really slow, so you kinda wanna use short clips, but it's pretty cool to hear your modelled fuzz box without having to breadboard!
The problem with using it for this sort of thing is getting an initial sample which is actually flat to begin with. You can't record any magnetic pickup because it will of course have its own filter involved. A piezo would be better for that, but then you have harmonic series from right at the bridge, with no good way of hearing what it might be like at the neck.
I have figured out a kind of half-assed way of getting an idea of the frequency spectrum of an actual guitar using Voxengi SPAN (it's my preferred analyzer, you could probably use another. I set it to infinite peak hold and then start strumming while walking up the neck with a bar chord. Go all the way up until you fall off the fretboard and you've kind of given it every harmonic the guitar can put out in normal operation, and I figure it's close enough to white noise (once integrated via the hold function) . The result ends up looking pretty much like the graphs above.
I was thinking the other day that the "screwdriver pull off test" that we use to determine pickup phase is about as close to a step function as we can get. I had an idea of like a spring loaded thing for consistency's sake, but one clean quick pull off should work.
And if you do that, you have an idea of what that particular pickup circuit is doing to the signal. Theoretically, you could then record your little demo clip and use inverse filters to undo the pickup's response and then feed that into the model. The steep drop off makes that less than ideal too, since you'll be bringing up a lot of noise along with the higher frequencies.
|
|
|
|
Post by sumgai on Feb 21, 2014 12:30:02 GMT -5
John, What you've shown is not a treatment of every audible frequency all at once, it's exactly as ash says, a stepping function that determines circuit behavior at one given frequency per time segment. What ash describes (and it's a good one, ash) is a much better way of representing actual output when several/all possible frequencies are introduced at the input. ('All possible' meaning the fundamental and the natural harmonics that would generated by something that produces sound in a natural setting. We see that as a guitar string, but it could be running a finger around the rim of a glass, or a chair scraping across the floor, etc.) Indeed, white noise is an excellent first approximation of a circuit's behavior, but it's still not the final be-all, end-all. ash, the Hold function is a good idea, but ideally we want to know what a single note does over time (or a single chord), sustained for several seconds. Realistically, every note on the fretboard should be done individually, one note at a time, and per clip - not all jumbled up. (Again, unless you want to view the performance of a specific chord.) Only in this way can you "see" what your ears hear as you play through the fuzz circuit. After all, that's why you built the fuzz box in the first place, right? At least, I'm assumming that's why you built it, to play a guitar through it, eh? Oh, right, I'm talking of ashcatlt, he who uses all manner of things in weird ways to come up with rather different tonalscapes.... almost forgot myself there, for a moment.  Anyways, regarding the charts shown by any spice program (at least as shown so far in the NutzHouse).... We know, without a doubt in our unmilitary minds, that frequencies interact. That means that harmonics reinforce or denigrate at those intersections. John, if your spice proggie were pretending to introduce several frequencies at once to the input of your circuit (and your modeled pickup should be doing so!), we'd see not a flat line leading to a resonance at one preak frequency, we'd see something like that shown by Don Tillman's graph. In my perview, what your spice graphs show me is how a tone control cuts off, rapidly, frequencies above a given point, but not how it affects the harmonics generated below that point - that's what we want to see, if we're going to get a realistic idea of what's going on. Make no mistake, I'm not bashing you or 5spice, I'm simply trying to "persuade" you that you're only at the first step in the audio spectrum analysis sweepstakes. In fact, both you and ash would benefit from using (or spice-emulating) a broadband spectrum analyzer. Useful with either white/pink noise or with a single frequency input, they can tell you loads more about how a circuit is affecting it's input than what we've seen so far. Or is that the old Engineer inside of me, trying to get out again? I thought I had him throttled back pretty good these days..... HTH sumgai |
|
|
|
Post by 0wnyourtone on Feb 21, 2014 12:49:42 GMT -5
Tone Pots - including 'No-Load' pots
Also, while offering the max brightness of a very high value tone pot, it still has the smooth tonal transitions of the smaller pot value. Seems good to me!
^ This ^ An A250K was the perfect solution for the LP copy I worked on the other day. You had the open presence at the top accompanied by a very smooth transition in sound throughout the entire range of the control. The next humbucker guitar I work on, I want to test some lower resistance volume controls in conjunction with the A250K no-load. I want that "blossoming" of open presence at the top of the tone, but to subdue the velocity of the resonant peak a tad - maybe a 250 to 300-some K pot would do it. Also, John's charts look pretty. |
|
|
|
Post by JohnH on Feb 21, 2014 16:04:24 GMT -5
Sumgai, I disagree with your statement. The plots on these and other similar threads are exactly like feeding white noise through, with all frequencies of equal magnitude at once. They also give a reference to the relative outputs of separate frequencies, if applied on their own. Adding signal at one frequency does not change response at another frequency in such a linear system. I think however, that you may be referring to plots such as these, by Tillman: 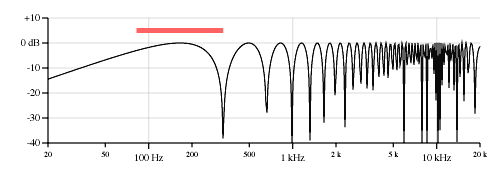 These are plots of the available outputs from a particular string of a certain length and open pitch and a pickup placed in a certain place, and fretted anywhere up the neck. This plot is a low E, 82.5hz if open, 25.5" scale, with a pickup placed at 1/4 length, which means that this string will be unable to output at a frequency where the 1/4 point is a node, hence there is a null from this string at 330hz (which is 4 x 82.5). But that is vibrating string theory and has nothing to do with electrical interaction of different frequencies. If I was to show a single frequency on one of the graphs, it would be a dot. If it came with some harmonics, it would be a series of dots. If I added another note, I would get more dots which would not change the first series unless they were exactly at the same frequencies. Overall, with many notes added, the graph would fill in. Ash describes how one might complete that process in a physical test by strumming every note. Here is about 15 sec of strumming, but of particular chords. Hence its uneven, and you can see the spikes from particular notes and their harmonics. But you can also see a trend in the response, and you can see the peak happening around 3khz, with a fall off above 5khz. All of that is reasonably in accordance with analysis. The main interesting difference was the stronger bass in this signal compared to treble (it was a neck pickup, and it also had some cab simulation). But that is specific to that guitar and set up. 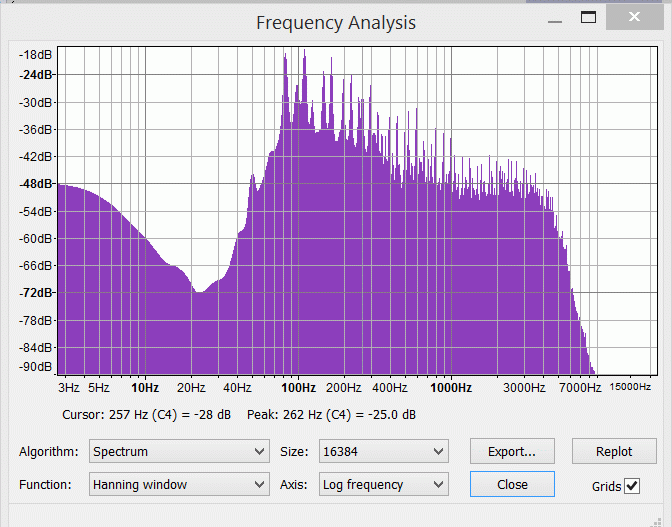 So I am using an even input for now, same magnitude at each frequency, so that the effect of circuitry can be seen in isolation. I don't want to make it more complicated than necessary, but I do intend to do some with a variable input derived from an actual guitar response, by way of illustration. But that will be separate. btw I not actually using Spice for most of this. I'm using the spreadsheet which is much faster to set up, but it's the same theory. If you think all these posts are no good, let me know and I will delete them all. |
|
|
|
Post by JohnH on Feb 21, 2014 16:07:33 GMT -5
Tone Pots - including 'No-Load' pots
Also, while offering the max brightness of a very high value tone pot, it still has the smooth tonal transitions of the smaller pot value. Seems good to me!
^ This ^ An A250K was the perfect solution for the LP copy I worked on the other day. You had the open presence at the top accompanied by a very smooth transition in sound throughout the entire range of the control. The next humbucker guitar I work on, I want to test some lower resistance volume controls in conjunction with the A250K no-load. I want that "blossoming" of open presence at the top of the tone, but to subdue the velocity of the resonant peak a tad - maybe a 250 to 300-some K pot would do it. Also, John's charts look pretty. Thanks, that's a good illustration of what I'm doing. Something which can be understood by looking at the analysis corresponds to something that works our well in the real world. |
|
|
|
Post by sumgai on Feb 21, 2014 22:38:17 GMT -5
John, I think you may have over-reacted just a tad there, me bucko..... I'm not attacking anything going on here, I'm simply stating my viewpoint, and I've done that so I'll not rehash it yet again. But to be frank, I think that second chart above is exactly what I was after. Now that I've seen it, and since you've stated that you may do some deeper analyses at some point in the future, I can sit back and wait patiently for the results.  sumgai |
|
|
|
Post by ashcatlt on Feb 22, 2014 10:56:49 GMT -5
Pretty sure that Tillman graph is a theoretical plot without any of the effect of the filter action. It must also be very near to the bridge, I think, or else normalized somehow to make all of the harmonics hit at the same level. But you can literally just add the tone control curve to the harmonic curve (just add the values at every point!) and end up with an idea of what that one pluck would do through that pickup at that point near the bridge. John, I called it out in passing in that other thread, but since it's in the title of this thread - It's not a pot. It's a rheostat. A variable resistor. But we know what you meant.  |
|
|
|
Post by JohnH on Feb 22, 2014 15:03:58 GMT -5
Ash, you make some good points on this and your previous post, addressed below:
Pot, potentionmeter, rheostat or variable resistor?
Mostly I'm talking about the action of that round thing with three lugs. And that physical component is a potentiometer (pot for short), and if you want some, then that is what you have to write on the order, whether or not you intend to wire all the lugs.
And if you talk to any guitarist who knows that there is something electrical behind the 'knob', then they will call it a 'Pot'. So I plan to stick with that for most purposes, even though you know that I know what you mean too! Also 'Pot' is three letters while 'variable resistor' has 16 and 'rheostat' sounds like something from Edison or Dr Frankenstein.
Ground and Voltage dividers
The idea of the ground is helpful in these circuits, even though I acknowledge that we may not be earthed to the planet, because it is a common reference point for the whole system. As you noted, its all about voltage dividers, in two dimensions when there are reactive components. For the circuits discussed here, there are three voltage dividers that need to be worked out, and they all happen to have 'ground' at the bottom, which helps the maths.
The first voltage divider is to work out the voltage at the output of the pickup, call it V1, so the 'top' of the divider is the pickup inductance and resistance, and the 'bottom' of the is everything else, including the pickup capacitance. Working out the impedance of the 'everything else' takes a careful step-by step combination of series and parallel impedances.
The second voltage divider works out the voltage at the top of the volume pot, V2. Once V1 is known, the only thing in the top part of this voltage divider is the bass-cut components, the bottom part is the volume pot, treble bleed and output (with any tone control in the 60's position)
Then the third divider, takes the value of V2 and generates the output voltage, basically its the volume pot top and bottom, each with whatever they each have in parallel.
The maths is all done with impedances and voltage ratios, converted to db's only at the end.
How do resonant peaks get generated?
That is an interesting question. From a maths standpoint, they can happen as a result of the inductance and capacitances having reactance's with opposite signs. It's best shown graphically, for a simple case. The following shows just the pickup, which has inductance, resistance and capacitance, and the output comes from a voltage divider, being the voltage across the capacitor. In the same way that a resistive voltage divider is worked out by ratios of resistors, one including reactive components is done by the magnitudes of impedances, even if they may be at different angles, like this:
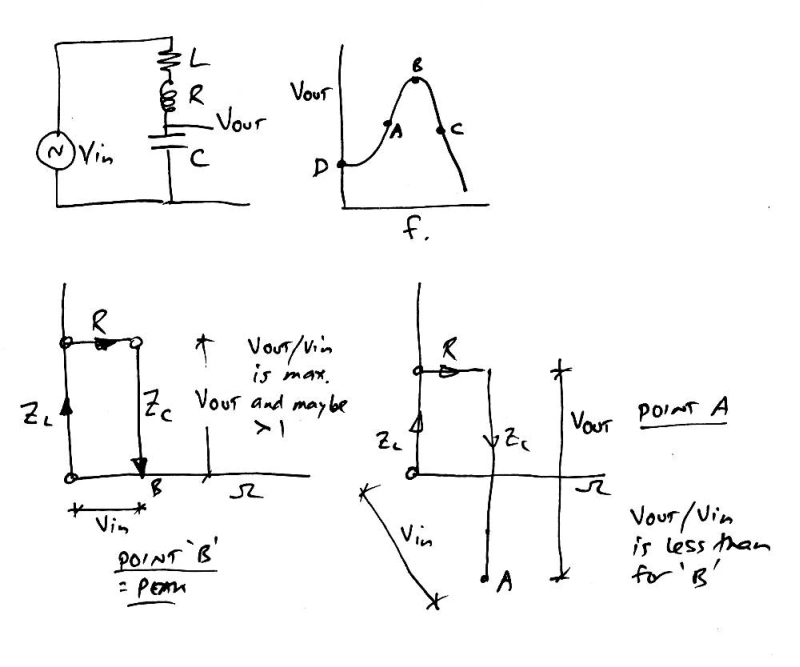
(btw, I never got taught this stuff properly, and this is the first time trying to explain it, so it may not be quite classical!)
Basically, there's a source creating a signal of zero impedance, ie it is unchanged by load. Across the source are the three components in series, and to plot their impedances on a graph, we go up for inductance, along for resistance and down for capacitance. At point B, the peak, the two reactance's are equal and point B is as close as it can get to the origin. The voltage ratio between that across the cap and the voltage of the source is as high as it can get, and may be more than 1. It is increased if R is less, and all that can be seen graphically. At a lower frequency, such as point A, the inductive reactance is less and the capacitive is more, and the ratio of the voltages is less. The angles of these vectors is also expressed on such a graph.
At point D, very low or zero frequency, inductive reactance tends to zero and capacitive tends to infinity. On a graph, the Vin and the Vout would be almost parallel and equally very long, so the ratio would be 1 and Vout = Vin, which is what we expect for this circuit, with dc. |
|
cooltone
Apprentice Shielder
 
Posts: 27
Likes: 6
|
Post by cooltone on Feb 14, 2016 18:58:42 GMT -5
This is a really interested thread. Another way to think about resonance is the wine glass analogy. The glass will ring at it’s resonant frequency when you tap it. - Does an LCR tone circuit ring? - Does ringing impact the tone? I had a look at the step response of an LRC circuit on LT Spice to see what the impact was: Input: 0 to 1V step L=4H with R and C in various combinations: R inductance = 6k R Load = from 100k to 1M C Load = from 400pF to 10nF The LCR circuit does ring: - Ringing decayed within 5mS with all R Load/C Load combinations - the ringing frequency was at the LC resonant frequency - The initial peak was larger with higher C Load values - The ringing decay was faster with smaller R Load values Practically, it seems the step function response can be ignored; it doesn’t add any new harmonics, the decay is so short few will hear it. Some background: www.zapstudio.com/Assets_Publish/EE_Circuit_2010_Lab_32.pdfI suspect that the maximum rise time of Vo (Slew Rate) at ) 0V is limited to the Slew Rate at the Resonant Frequency - and this is why the frequency response rolls off after that. Since in the steady-state the pup circuit is linear, I believe the frequency plot is the best/most practical tooI. My problem is trying to interpret exactly what setting the resonance will sound like in practice when at different frequencies and peak values. But what to do? Rolling caps and resistive loads (vol and tone pots) is a bit hit and miss. Creating an input sample seems more complex each time I think about it. What do you think creating a map of Resonant Peak Value Vs Frequency with descriptions about the useful areas? |
|
|
|
Post by Ro_S on Nov 4, 2018 3:34:41 GMT -5
Very important info in the opening post, about how pot values affect the brightness of a pickup. Thanks, JohnH. I shall have to consider this aspect carefully when deciding on the pot values of my guitar mods. |
|
|
|
Post by Ro_S on Nov 4, 2018 11:23:06 GMT -5
JohnH - A question, please... sorry if it stupid one, but.... On a guitar with tone and/or volume pots configured to independently control individual pickups (like on a Les Paul, for example), rather than global tone and/or volume pots controlling whatever pickup(s) is currently selected by a selector switch, will the pots relating to, say, Pickup 'B' load the circuit sound affecting the sound of, say, Pickup 'A' when the latter pickup is selected only ? I am assuming the answer is probably 'no'. And hence why, for example, a bridge Strat pickup selected on its own, and wired in the vintage or traditional manner (i.e. without a tone control), contributes to it sounding so bright. But I am unsure. Oh, and, secondly, when both pickups (assume a two pickup guitar) are currently selected by a selector switch to be combined together wired in parallel, I assume that ALL volume/tone pots on the guitar indeed do load the circuit sound causing it to darken in tone, so why does a parallel combination of pickups not sound less bright tonally that it typically does (despite the significantly reduced output inherent in a parallel combination of pickups) ? thanks p.s. I hope this was an appropriate place to pose these questions. please move if not. sorry. I think it is directly relevant to the topic of the thread though?
|
|
|
|
Post by Ro_S on Nov 26, 2018 6:07:34 GMT -5
JohnH - please could you help with my above post. many thanks.
|
|
|
|
Post by JohnH on Nov 26, 2018 14:02:58 GMT -5
Hi RoS
A pickup and its controls, switched off by a circuit like in an LP has no effect, as you noted. When two pickups are combined on an LP, both at full volume, then both tone controls affect both pickups equally since they are all directly connected to each other via the volume pots at 10. As you turn down each volume, you can start to use one tone to affect its own pickup more than the other. But as you turn volume lower, the volume pots start to shunt each other, and if one is turned very low or off, then it kills the other pickup.
The reason that both pickups switched on, with all knobs at max doesn't sound dull is that, although there is twice the load on the system from both sets of controls active, there is also twice the drive available from both pickups active. And to further help, there is only one cable to the amp, so the relative effect of cable capacitance reducing treble is reduced. Or another way to look at it, the output impedance of the guitar is halved when both are on.
|
|
|
|
Post by Ro_S on Nov 26, 2018 16:08:29 GMT -5
The reason that both pickups switched on, with all knobs at max doesn't sound dull is that, although there is twice the load on the system from both sets of controls active, there is also twice the drive available from both pickups active. And to further help, there is only one cable to the amp, so the relative effect of cable capacitance reducing treble is reduced. Or another way to look at it, the output impedance of the guitar is halved when both are on. - When you use the term 'drive' how is that different to output? (I thought the output of two pickups in parallel is less, not double, that of one pickup alone?) A supplementary question, also: Take a Gibson LP or 335 type guitar with two humbucker pickups. In relation to the loading effect of all four pots of a traditional LP/335 control configuration layout, how much different will the both pickups in parallel setting sound compared to if the same guitar instead had a single (global) volume control and single (global) tone control ?? (Assume all controls at max in both cases. And all pots are 500k in both cases. Thus half the loading effect of pots in the latter case described above, right?) thanks |
|
|
|
Post by JohnH on Nov 27, 2018 14:09:27 GMT -5
Pickups in parallel don't really reduced output compared to one, but it may sound a bit smoother as a few upper harmonics might average out or cancel. One master volume and tone after two pickups should sound a tad brighter than if both pickups had their own V and T controls, dies to less loading per pickup.
|
|
carlosg
Rookie Solder Flinger

Posts: 17
Likes: 0
|
Post by carlosg on Nov 21, 2022 8:47:59 GMT -5
So 500k vol 500k tone sounds the same like 250k vol no load tone?
|
|
cooltone
Apprentice Shielder
 
Posts: 27
Likes: 6
|
Post by cooltone on Apr 30, 2023 9:16:54 GMT -5
So 500k vol 500k tone sounds the same like 250k vol no load tone? Assuming both pots are full on the frequency response will be the same. |
|
cooltone
Apprentice Shielder
 
Posts: 27
Likes: 6
|
Post by cooltone on Apr 30, 2023 9:48:57 GMT -5
To add to the discussion; amplifier input impedance affects tone significantly. I know it's obvious, but I had to rediscover this recently when building a source-follower buffer.
I prefer using the low impedance input of guitar amps. On a fender 5e3 design this is a divider made with two 68k resistors in series giving an input impedance of 136k.
To maintain an equivalent tone profile I had to load the pickup with the equivalent of 2 x 250k and 136k all in parallel(65k), otherwise the pickup sounded too harsh.
As a consequence it seems that JFET buffers need to be permanently voiced a low-gain like tone or high-gain like tone (the gain isn't changed by the buffer).
The resonant peak with 1nF (10 MTR cable capacitance) and 65k load was just over 1dB, much less than 3dB+ in the graphs above and still quite shrill.
|
|


