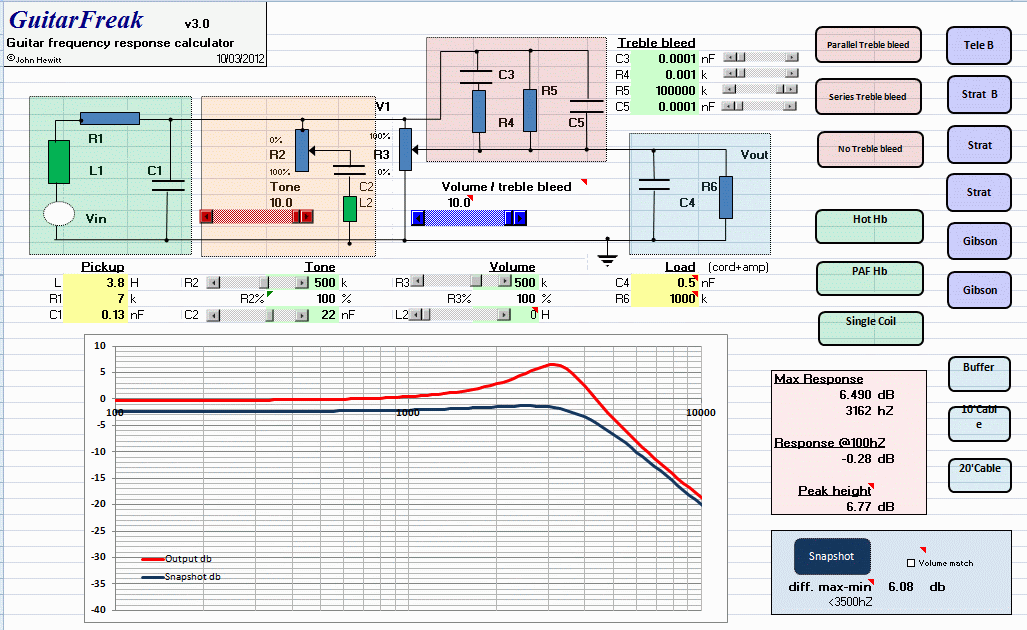
Post by JohnH on Oct 6, 2008 1:26:26 GMT -5
The latest version is now GuitarFreak 6.6, which is a minor enhancement since versions 6.5 and 6.4
GuitarFreak6.6 (excel 2013, 2016, 365)
Version 6.6 should also run in Excel 2007 and 2010 but I haven't tested it.
I also down-saved it to Excel 97-2003:
GuitarFreak6.6 (excel 97-2003)
All the guidance below still applies, from version 6.4.
New features in 6.6 include the following:
- Additional components in the Tone circuit, to allow a standard tone resistor/cap to be in parallel with a more exotic version
- The parallel treble bleed will select an optimum resistor depending on volume pot value
New features in 6.5 included the following:
- A considerably expanded range of pickup models, both as complete sets and individual pickups
- An additional resistor added to the treble-bleed network to enable a new option of the Fender Tonesaver circuit, as built into current 2017 stock American Stratocaster Pro models
- A few minor tweaks and bug fixes
The pickup models are all based on the detailed testing by Antigua, and huge thanks are due for his diligent and comprehensive work. For GuitarFreak, only a small selection is included, mostly cherry-picked to cover the main types focussing on well-known and classic models. There are several LP, Strat and Tele versions, plus new for 6.5, two Gretsch-based sets (Filtertron and TV Jones) and a combined Jazz/Precision bass.
See below for all test results:
guitarnuts2.proboards.com/board/30/pickup-testing-modelling
If anyone running GF wants to use it with other pickups from the testing archive, let me know. it doesn't take long to derive the models, though it is not an automatic process.
For the Bass model, which has a 34" scale, the N and B pickups represent the J-bass with pickups in their classic positions, while the M pickup is the single P bass. pickup, with the treble side of this split PU defining its position (adjustable). To properly use the bass model, set the A string to 55hz on the 'Strings and Pickups' page, and use strings 3, 4, 5 and 6 for a four-string bass.
GF was first written to investigate treble-bleed circuits, so when Fender started to build them into their stock US models, I wanted to be sure their design can be captured. The Fender TB circuit is a parallel 150k/1.2nF R & C all in series with another 20k resistor. There is now a dedicated option button in GuitarFreak for this, since I suspect it will become the most common TB design on any stock guitar. I'll run some comparisons in another thread soon.
(edited 3/9/2016 for version 6.4)
Latest news
GuitarFreak now includes a range of considerably more accurate pickup models than in previous versions. These were derived based on tests on GN2 . Thanks are due particularly to Antigua and Stratotarts. The tests were used to derive models of real pickups that allow for damping and the more subtle changes in response as loading is varied. It can now show things like how different alnico single coils might vary, or how a coil-cut humbucker might differ from a true single.
Also new, in addition to versions in Excel 2007-2016 and Excel 97-2003, there is a native version in the open-source .ods format, written in LibreOffice5.2 which is a free download.
Quick Start
For a quick intro to step through how to work with GuitarFreak, see this link, in which a particular scenario is modelled step by step (a Fender 'Vintage Noiseless' pickup is compared with a no-load tone pot and a TBX tone control)
GuitarFreak6.4 - Step by step guide on Strat Talk
Introduction
GuitarFreak is a spreadsheet that plots the frequency response of an electric guitar, with all the main variables adjustable, so you can see what happens when you change pickups, or try a different pot value, or a new capacitor, and also what happens when you turn the knobs. The advantage it has over circuit modelling programs such as LTSpice or 5Spice is that the graphics respond immediately as you press buttons and move sliders etc, so it's very interactive. Also, it can include the main non electrical effects such as pickup placement and string harmonics.
The model is intended to be visual and highly configurable, and many changes to component values, tone control circuits and pickups etc may be modelled and quickly compared.
The purpose of Guitarfreak is to help with design choices about wiring and pickup selection. It is intended to be complementary to listening and testing, by giving extra insight into how tone is affected when changes are made or when control knobs are adjusted. It can help answer questions such as:
'what happens if I change a pot value?'
'what treble bleed values would best preserve my tone?'
'what will a TBX tone control do on my guitar'
'what component values will preserve the treble best if I try series wiring?'
'how important is the guitar cord?'
'How similar is pickup A likely to sound to pickup B?', and
'How can I make pickup A sound more like pickup B?'
The effects represented include pickup type, pickup position, tuning of strings, scale length, fretting position, picking position and the electrical characteristics of the pickups and guitar circuitry as far as the amp input. Up to three pickups can be combined in series, parallel and in or out of phase. Tone controls can be before or after the volume pot, and several configurations of tone control can be selected. Different guitar cords can be tested and treble bleed circuits of various types tested. Several plots can be stored so that the results can be compared.
Current Version: GuitarFreak 6.4
The current version is 6.4 as follows, in three spreadsheet formats:
GuitarFreak6.4(excel 2007)
GuitarFreak6.4(excel 97-2003)
GuitarFreak6.4(LibreOffice 5.2)
Functionality is the same, with slight adjustments for the .ods format to best suit the open-source spreadsheet.
To use Guitarfreak6.4, ensure that macros and ActiveX functions are allowed in your settings.
There is also the most basic version, GuitarFreak 1.0 .This ‘lite’ version has the basic component values available to type directly into the yellow cells. There are no macros or other controls, and it should be back compatible at least as far as Excel97. It covers only electrical effects.
(Dec 2014: A recent security update to Excel may prevent slider controls from working. Until MS update this, the 'fix-it' on this page seems to repair the problem:
support.microsoft.com/kb/3025036/EN-US )
Main page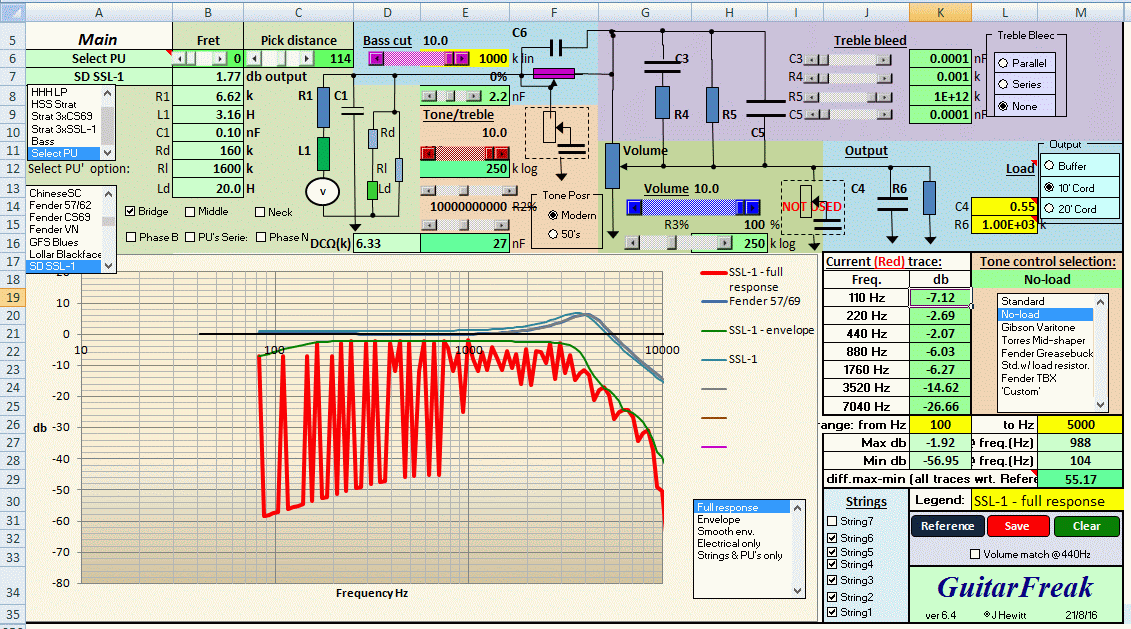
The Main page is key, and is all that is needed for testing most scenarios. The page is presented around a schematic circuit diagram of the guitar, and the electrical model of the pickup. This is intended to help convey what is happening, but it's not necessary to understand this circuitry to use GuitarFreak.
Output is on a graph of frequency vs decibels.
Most component values and controls are on grey sliders and knob controls are on coloured sliders. Yellow cells can be typed directly into.
Pickup selection
In the top left, pickups are selected. In the upper menu, chose either a preset complete guitar with three pickups, or chose 'Select PU' and pick from the full menu of pickup types in the second menu at the left. Guitars and pickup data can be added and edited on the 'Strings and pickups' page.
You can select Bridge, Middle and Neck pickups singly or in any combination, with phase changes and series or parallel for the combinations. When more than one pickup is chosen, the properties are combined with output from each in proportion based on the pickup positions and electrical properties of each.
Fretting and picking positions
Also at top left, you can select the fretting (fret 0 = open strings, up to fret 24). and picking position (mm from the bridge). If the output is set to include these effects, you can see them on the graph, ie, pick nearer the bridge and bass is reduced. Fretting position affects the balance of harmonics.
Graphing and output functions
The graph function can record up to 10 traces at one time, each with an individual legend. The live trace is in red, and moves interactively whenever settings are changed. The 'Reference' button will copy this, including the current legend, to the dark blue trace, after which it will remain fixed until updated again. Further traces can be recorded with the 'Save trace' button. 'Clear' will delete saved traces, leaving only the main 'Reference' and live red trace.
In the lower right of the screen, is the 'Tone Comparison' box. This compares all traces to the reference trace and reports the greatest tonal range,independent of volume, for any of them. For example, if several traces are all identical tonal shape but at different volumes, a zero result will be shown, but changes in tonal balance will show a higher result. Note that a range of <3db is a close result, ie, tone will be very similar. This feature is good for working out designs for circuits such as Treble bleed, where the object is to keep tone consistent across a wide range of volume. You can choose the frequency range over which comparisions are made.
There is a 'Volume match' button next to the 'Reference' button. This rescales all traces to appear equal at an arbitrary 440hz, so that tonal differences can be more easily compared, separately from volume differences. Deselect this and they return to normal.
Note, the current graph is repeated on the other pages, including the Graph page, where a larger version is seen. This page is also where data from saved and reference traces are kept, and data can be edited there too.
Graph options
Output can be presented using several options to include or exclude various effects. This is chosen on a menu at the lower right of the Graph.
'Full Response' includes the most, with each active string producing 30 individual harmonics at specific frequencies and amplitudes based on fretting and plucking position, modulated by the pickups and their positions, and then shaped by the electronics. This plot is most like what is recorded if you make a frequency plot from a real guitar.
'Envelope' is similar to the above, except the individual harmonics are replaced by a function that envelopes the overall magnitudes. This gives a smoother plot that maybe be more useful.
'Smooth Envelope', as above, taking maximums across a +3/-2 semitone range, to further smooth the plots.
'Electrical only' includes only the electrical characteristics of the pickup and guitar circuitry, without effects of pickup and fretting position, nor the harmonics within each string. This plot matches what would be created by Spice modelling, and also the testing of pickups used to derive the models. This plot can be the most useful for investigating circuit parameters.
'Strings and pickups only', is like 'Full response", without the electrical effects.
Tone controls
There are built-in models of several different styles of tone control (see menu at the right), which can be changed with one click. In addition to a standard tone control, there are 'No-load', Gibson 'Varitone', Mid-shaper (eg Torres), and Grease-bucket and TBX from Fender. There is also a standard tone control with an extra load resistor across the volume pot for circuits where the pickup needs more load. Plus, there is a separate bass-cut control included, which is out-of-circuit when at max. This, with standard treble control, would allow G&L PTB wiring to be modelled.
Except for the bass cut, which needs to be before the volume control, the other tone control styles can all be placed either before or after the volume pot (ie, 'Modern' or '50s' wiring). So if you want to check out a modified TBX, with added inductor in 50's position, with bass cut included, then go for it, (and save your guitar from being hacked out in order to try it!). Note that the load resistor model assumes that 'Modern' wiring is used.
Treble Bleed
There are several components on the volume pot for testing treble bleed circuits. They have grey sliders, but can also be set to two standard recipes, or removed, using option buttons. Most guitars do not have this feature, but if you include it, the parallel option is usually the most effective at maintaining treble tone at lower volume. You can tweak the values using the sliders.
Cord length and amp input
The guitar cord is critical in determining tone, and there are two yellow cells where cable capacitance and anp input impedance can be typed. I suggest to add about 0.1nF to cable capacitance to allow for amp input capacitance. There are also option buttons to put in generic typical values for 10' and 20' cords, or much less if you have a built in buffer in your guitar.
Strings
At lower right, are selection buttons to switch each string on or off. Seven strings are shown, and the default is standard tuning over the top 6 strings, with the 5th string 'A' being at 110hz. This can be varied on the 'Strings and Pickups' page, such as to test drop tuning, or, a bass guitar (string 5 = 55hz, using strings 3 to 6 for a 4 string bass).
Its quite interesting to switch on 'full response' output, with just one string, and see how the harmonics vary with fretting and pickup position.
The 'Tone' Control Page
In order to keep the main page from excessive clutter, the details of the tone control options are on a separate page. Visiting this page is only really required if you want to change values on non-standard arrangements, since the basic tone pot value and main tone cap are also on the 'Main' page.
The different tone control circuits are created by forming a single more complex circuit, with all of the components needed to make any of them. Values for parts not needed are made very large or very small to negate their effect, leaving the active ones as required to control the result. The key values for each style of tone control can be changed with sliders of by entering into yellow cells. There is a 'Custom' option too, where the user may adapt any of the values to create a new combination. Formulae or specific values can be copied or entered here. Also on the 'Tone' page, the taper of pots can be changed from linear to log, and the choice is also reported on the 'Main' page next to each one. A 10% taper is assumed for log pots.
To change tone control types, use the menu at the right of the 'Main' or 'Tone' pages.
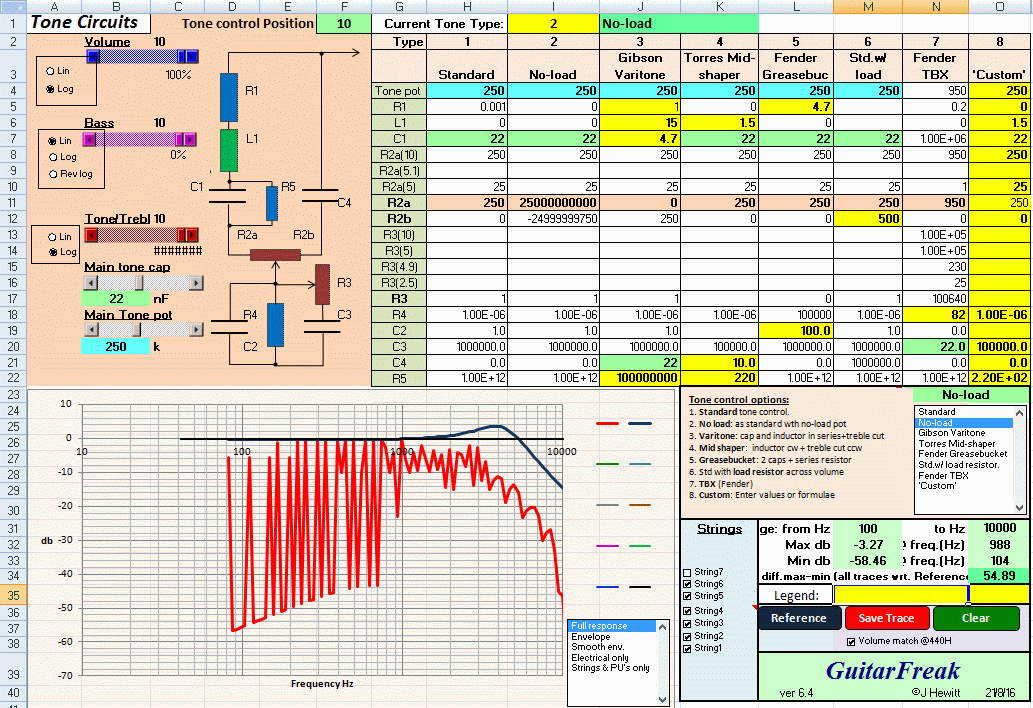
The way the tone circuits are modelled is shown further on the Notes page.
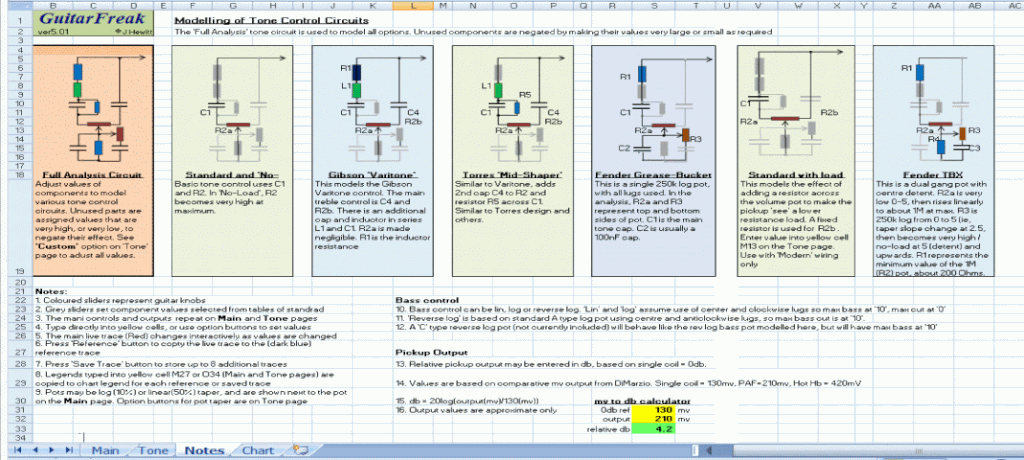
'Strings and Pickups' page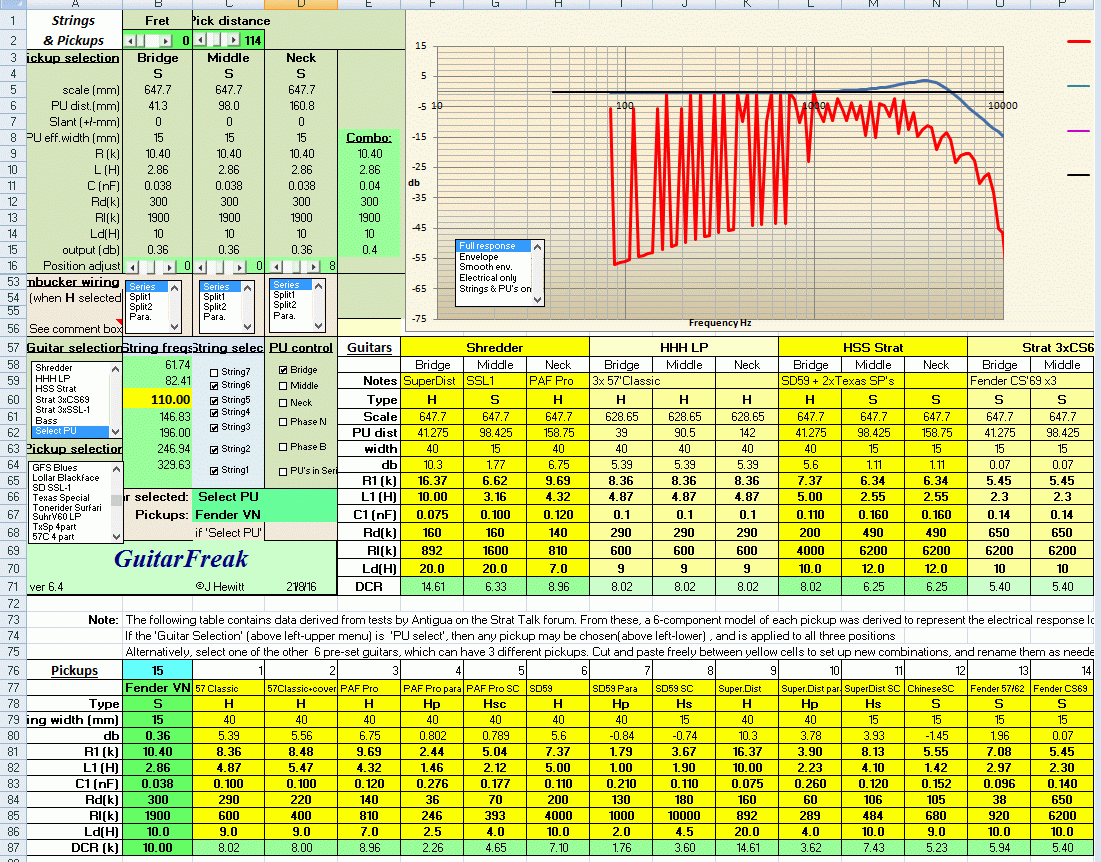
The guitars, strings and pickups are further controlled on the Strings & Pickups page, which is where all pickup data is entered and stored. There are two banks of yellow cells, the lower set are individual pickups derived from tests, while the upper set are in sets of three as complete guitars.
In each case, each pickup has 6 electrical components plus a relative db output. These 6 components allow the characteristics to be captured much more accurately than the more usual model of single resistance, inductance and self-capacitance. But, if test data is not available, a 3 component version can be entered by putting very high values (eg 1E12) for the extra parts (references Ld, Rd and Ll). New pickups can be added and others changed and cut/pasted freely.
The pickups are designated 'S' or 'H' for single coil or humbucker. They have a string sensing width, which is wider for humbuckers than for singles. There is also options to derive approximate models for single coil and parallel versions of humbuckers based on approximate formulae. But most of the humbuckers already included also have specific tested versions for single (slug coil) or parallel, so these are more accurate than the formulae.
There are about 20 different pickups modelled to date (Sept 2016) covering a wide range of styles from Hot humbuckers, to vintage singles, and more will be added over time.
References
Component Values
A useful table of values for inductance, resistance and capacitance of pickups can be found here , by Helmuth Lemme and explained here:
The Secrets of Electric Guitar Pickups
This is a summary of Fender pickups, showing Inductance:
Fender pickup properties
Here are some more, measured by a chap on the SD forum:
Pickup data
(the cap values look too high to be just the pups alone though)
And see the Pickup sub-forum on Strat Talk, particularly the 'Analysis and Review' threads:
Strat Talk - Pickups
Theory:
Electrical interactions
GuitarFreak calculates responses at each semitone, ie 12 per octave, using lines of spreadsheet code. The theory is based on combining sub-circuits in series and parallel, using complex numbers to represent real and imaginary parts. Thanks to Ohm, Kirchoff, Thevenin and Norton for all the great theory (cheers guys - much appreciated!)
String Harmonics
Harmonics existing within a vibrating string are affected by where you pick, and generally decline with higher frequency.
There are a number of studies on this, one of which is linked on the Notes page.
Jungmann
This is a graph, based on Jungmann, showing how individual harmonics from each string, tend to fall under an overall envelope:
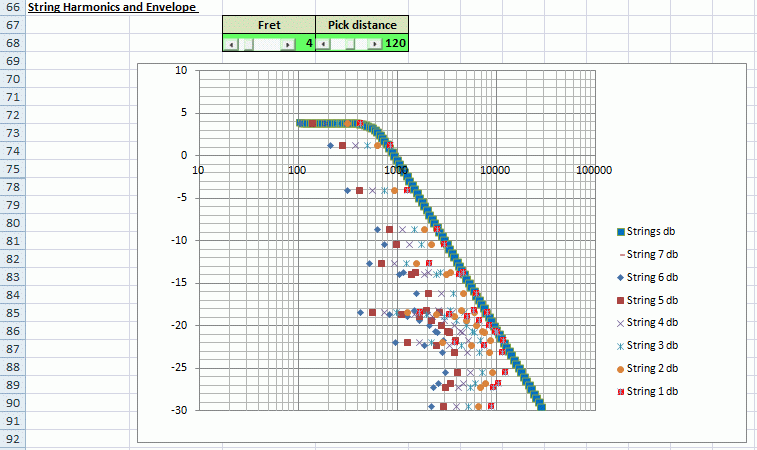
The values plotted are based on the velocity of the vibrating strings, which is what sets the level of output from magnetic pickups. There are many dots representing individual harmonics of particular strings. From that, the envelope is derived, which is flat up to a critical frequency, then declines at -6db per octave. So for the enveloped plots in GuitarFreak, the system is aiming to represent the outer bounds of the loudest harmonics, rather than every individual string harmonic. This envelope approach allows reasonably smooth plots to be derived representing overall frequency response.
Note that I the 'Full Response' outputs, each real harmonic is shifted to the nearest semitone to fit into the table of frequencies being calculated.
Pickup Response
A very good reference on the response of pickups based on position is by Tillman:
Tillman
An individual pickup will present a response modulated by where it is on the guitar. Nearer the bridge obviously provides less bass. Also, at frequencies for which the half wavelenth divides exactly into the distance from bridge to pickup, there will be a null with no output. this null frequency depends only on the string tension mass and scale length, and not on where you fret nor whether it is a fundamental or an upper harmonic.
Accuracy?
A trace from a spreadsheet analysis can never be 'accurate' with respect something as complex and variable as a guitar sound. But I think with the current provisions, GuitarFreak is capturing most of the most important effects, in a way that usefully represents them. Here is a plot in which recorded tones from a neck single (Texas Special 6.2k) are compared to a modelled equivalent using the best test values available for all parameters (and honestly no 'fudging' the results, except to match the overall levels as closely as possible):The calculated envelopes are matching the peaks of the actual response, generally within 2db or so. 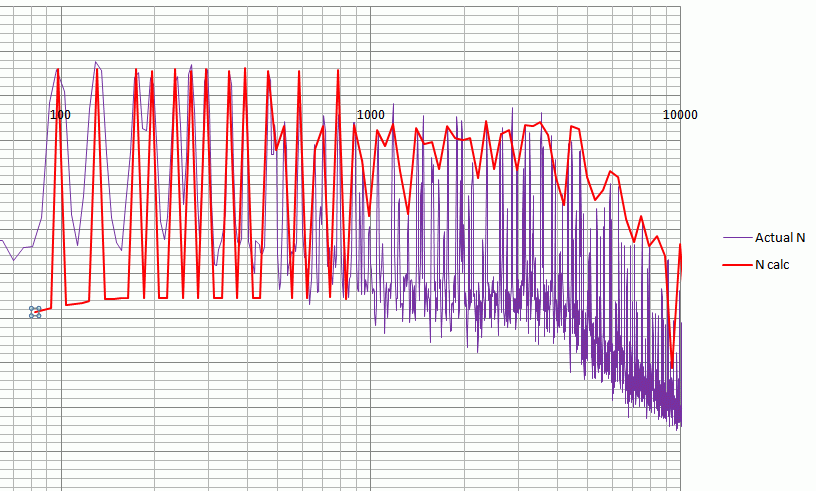
The main thing I see from the results is that the peak treble response, which on an electrical-only plot appears as a huge and unwelcome bump, is actually when seen in context, the last bastion of treble available as real response falls off, and is therefore as expected, seen as a desirable characteristic.
I hope that this version of GuitarFreak will be useful to others. If you try it, I'd be grateful to know how it goes, does it run for you? Was it useful?
regards
John


