|
|
Post by ms on Jun 23, 2022 7:33:39 GMT -5
For this non-linearity, the maximum difference in sensitivity is between the point of furthest positive string excursion and negative excursion. But the velocity is zero at the points of maximum excursion and so the output is zero, that is, the same. The output is small near the points of maximum excursion as well. Highest velocities occur closer to the equilibrium position of the string, and so the positive and negative peak outputs tend to be the same. So the effect of this non-linearity is not so large.
The asymmetry seen in the pickup output is mostly a result of even harmonics in the string motion. For example, the test waveform sin(t) + cos(2*t) has positive and negative peaks that differ by a factor of a bit less than two. If this waveform were the output of a pickup, it would result from its integral, -cos(t) + .5*sin(2.*t). This last waveform is symmetrical. Thus we might have asymmetrical pickup outputs that are the result of peak string excursions that are the same in the positive and negative directions.
|
|
|
|
Post by ms on Jun 21, 2022 13:13:44 GMT -5
Yes, a difference in the wire sizes makes sense. Changing the wire size to one size smaller makes the resistance rise by 1.26 times. You are measuring 1.20, close enough in the real world.
I do not see why they do this, nor why they call it dual resonance. The primary resonance of a pickup is a result of the inductances of the two coils in series, and the cable capacitance in parallel with the capacitances of the two coils in series. I suppose that there could be some subtle differences well above this resonance.
|
|
|
|
Post by ms on Jun 20, 2022 5:52:55 GMT -5
|
|
|
|
Post by ms on Jun 17, 2022 11:48:31 GMT -5
I think the first thing to understand is why the B and N of the evol have the same inductance. Presumably the B has more turns since it has a higher resistance; why is the inductance not higher? It must have something to do with the magnets. Ceramic magnets should not directly affect the inductance (low permeability), but there is an indirect effect. The thicker magnet on the B could be stronger and might move the poles further along their hysteresis curve to where the permeability is lower, canceling out the effect of more turns. I am guessing that the designer wanted to use a stronger magnet on the B, and then noticed that the inductance decreased. So he (or she) increased the number of turns to bring the inductance back up.
OK, lot of speculation here.
|
|
|
|
Post by ms on Jun 17, 2022 6:14:17 GMT -5
Plenty of iron in Ferrite (https://en.wikipedia.org/wiki/Ferrite_(magnet)). Steel pole pieces raise inductance; more steel can raise it more, and extending them past the ends of the coil can also raise the inductance because it keeps more flux inside the coil by making the field lines straighter near the ends of the coil.
Example: It appears that a PAF type humbucker is designed to have the same sensitivity to hum fields in both coils to get good cancelation. The screw poles are thinner, but they extend outside the coil on the bottom. I think this is for better balance.
|
|
|
|
Post by ms on Jun 3, 2022 7:23:27 GMT -5
Pickups using low permeability cores are low output, but they are not useless. For example, antigua's current discussion is about firebird pickups using a ceramic blade magnet as a core. He rejects them for their low output, but not everybody does. (Those looking for a basic discussion including the rule of thumb: hard magnetic materials (permanent magnets) have low permeability, soft magnetic materials (low permanent magnetization) can have high permeability, could look here idealmagnetsolutions.com/knowledge-base/magnetic-permeability-table/. The Wikipedia article on ceramic (ferrite) permanent magnets says they have high permeability. There are many kinds of ferrite, but I do not believe that that combination is possible.) Everybody's favorite musical permanent magnet, AlNiCo, has a relative permeability of just a few, and Zollner points out that nearly all the output is generated in the part of the coil nearest to the string in a strat pickup. Also, I do not see a problem with using the field from your simulation to excite a high permeability pickup core in another simulation. The potential problem would be that in reality the core magnetization would alter the string magnetization, requiring a complicated self-consistent solution. However, I think it is much too weak to matter. |
|
|
|
Post by ms on Jun 2, 2022 7:29:20 GMT -5
That modeling looks really good, and I think the results are close to the actual physical situation.
I think it is possible to use this 2D model to get a reasonable estimate of the voltage generated by a pickup, although it might be a bit of a stretch. We need the flux change through the coil when the string moves.
1. In the 3D case think of moving the coil instead of the string.
2. The box on the color plot is a disk with a hole in the middle in 3D.
3. Consider the change in flux in the part of the coil closest to the string when the hole size changes.
4. Consider subtracting the integrated flux before and after changing the hole size by a small amount.
5. This is a short piece of thin walled tubing, a small rectangle in 2D, ignoring the outer rim.
6. Integrate this flux in the small rectangle.
7. Estimate the fraction of this flux that would pass through the top of a 3D coil.
8. Multiply the result of 6. by this fraction.
9. Use this value to estimate the flux change in the rest of the coil, using the model results
to determine approximately how fast it falls off.
10. Add it all up.
|
|
|
|
Post by ms on May 31, 2022 13:13:39 GMT -5
Given that PAFs generally show about 1/4th the field strength compared to Fender AlNiCo 5, can you guess as to how likely one is to saturate the guitar string compared to the other, supposing that the pickups are an average distance from the strings, say five millimeters? Do you think that this string saturation will cause a slight suppression of higher harmonics, since the magnetic focus essentially becomes wider? I think a humbucker located 5 mm from the string (which is a farther than I would for a bridge pickup, but might be necessary for a neck pickup depending on the height of the action) probably does not get to full saturation. A Fender sc type with A5 does easily, or so it appears. What we are measuring is the flux pointing along the string in the string. It is changes in the flux pointing through the coil that induces voltage in the pickup. These two are related in the following way: Where the flux pointing along the string changes slowly with distance along the string, there is almost no field outside the string. Where it changes quickly, we do get a field, and that includes a component pointing through the coil. (Think of replacing the string with two long thin cylinder magnets with like poles nearly touching.) Now you can see why I put the results of weak and strong field on the same plot. Both show relatively rapid change near the pole piece, but slow change elsewhere. So the length of the sampling window does not depend much on whether the string saturates. (As Zollner pointed out, this is a bit more complicated for a hum bucker if the flux from a pole in one coil extends along the string to the corresponding pole of the other coil.) |
|
|
|
Post by ms on May 31, 2022 7:09:30 GMT -5
Here is the measurement of the magnetic flux along the string for the low field case (blue, same measurement as the first post here) and high field (orange). 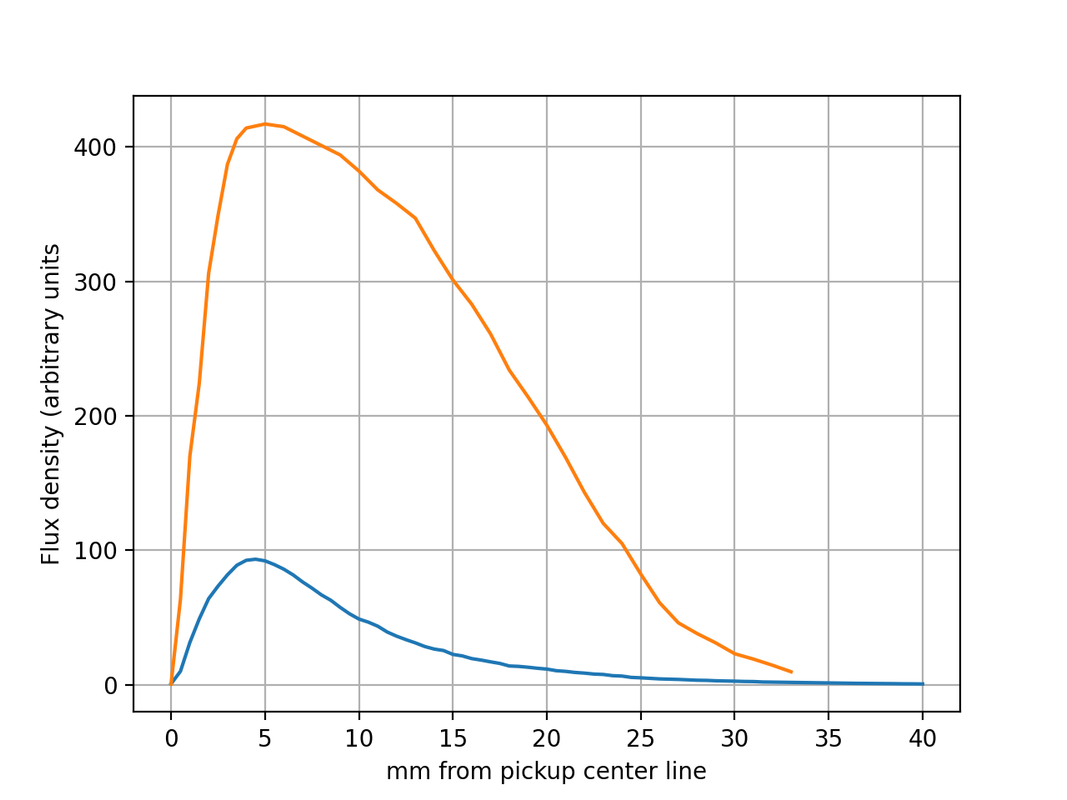
The effects of saturation on the shape of the flux along the string are evident. The flux is probably underestimated somewhat because the measurement uses only the fundamental of the response. As shown in a previous post, the response in time is a similar to a rounded square wave, and the harmonics are not included in this cross spectral measurement, used because it gives high signal to noise ratio conveniently. Some of the noise in this measurement is undoubtedly the result of variations in temperature increases in the wire in the driver coil (that is, not waiting long enough between measurements). It would be good to improve the setup before making measurements of strings made from different grades of steel for comparison purposes. |
|
|
|
Post by ms on May 26, 2022 10:19:51 GMT -5
The strength of the McDonald analysis is that it shows you how the equations of E&M describe how a signal voltage is generated in a guitar pickup. The assumption of a constant B field pointing perpendicular to the face of the pickup is not right. In fact, it is one of those "spherical cow" assumptions that physicists are supposed to be fond of making. (We all know that cows are rectangular so that they can pack in cartons of milk more efficiently.)
A guitar string is long and thin with a relative permeability typical of high carbon steel, about 100. Such a structure magnetizes almost exclusively along its length if there is a component of the driving field in that direction. The field from the pole piece bends over as it emerges from it, and so there is. Notice that the magnetization flips direction right over the pole piece, and is zero right over the center. It is this change in magnetization that generates the component of the field that points through the pickup coil.
The sampling width of the pickup is about equal to the diameter of the pole piece, not the width of the pickup as many assume for convenience.
|
|
|
|
Post by ms on May 22, 2022 10:24:34 GMT -5
So if you excite with 400G and you see apparent saturation effects in the wave, is it safe to say the guitar string is saturated in situ? And would hysteresis / saturation in a guitar string manifest as a distortion or just a loss in output amplitude? Surely saturation implies less distortion. The flux returned to the coil depends on the distance of the string from the pole and the degree of magnetisation of the string. In the absence of saturation both of these dependencies would have similarly shaped curvatures that would multiply. Saturation removes or diminishes one of these dependencies.
This is a really useful experiment answering a fundamental question about the state of magnetisation of the string.
I wonder, if the test rig were not a guitar but just something fixed to the bench, could the coil be cooled by immersing most of it in distilled water or light oil?
Yes, I think that would work. The dielectric constant of the cooling medium should not be an issue, I think. A metal tank would be good for cooling the cooling medium. You could let it run until it heats to equilibrium, and then it should be stable enough for good measurements. But for now, I will attempt a set of measurements similar to that shown in the first post, but with the larger field using the current setup. This will be slow, but might give some useful information. |
|
|
|
Post by ms on May 22, 2022 10:04:51 GMT -5
So if you excite with 400G and you see apparent saturation effects in the wave, is it safe to say the guitar string is saturated in situ? And would hysteresis / saturation in a guitar string manifest as a distortion or just a loss in output amplitude? To add to what aquin43 wrote: if you make a model of the string magnetization with a pair of long thin permanent magnets, the model is more accurate if the string is saturated. I should also point out that "400 Gauss" is approximate. I calibrate by connecting the coil to a dc supply and measuring the B field with a Gauss meter and the voltage across the coil. Then I measure the peak ac voltage during a measurement with a scope. It would be better to set up an audio amplifier module as a current source with both ac and dc capability. |
|
|
|
Post by ms on May 20, 2022 7:26:26 GMT -5
What do we observe if we make the “AC magnet” much stronger? There are several steps in these observations using a much stronger time varying electromagnet magnet: Preliminary: As described near the end of the first post, locate the tiny string coil where the largest signal is observed using the driving coil described above. Locate a strong magnet above the string and over the driving coil, and observe that with at least several hundred Gauss you can significantly reduce the amplitude of the signal from the string coil. This means that we can move the state of the string along a hysteresis curve to where the permeability is lowered, and so it is worth proceeding with more directed observations. 1. Make a better driving coil; this one also uses a core of #43 material, but it is wound with about 100 turns and has a resistance of about three ohms. It can be driven from an audio amplifier at 400 Hz and delivers about 400 Gauss at the top of the core. 400 Hz is low enough to keep small the inductive effects on the impedance, but high enough to give good sensitivity for sampling and recording with a scope. Heat is the limitation: the coil cannot be excited for more than a couple of seconds without producing a noticeable odor. So far I have not destroyed it. You also have to wait a long time between measurements for the wire to cool. Hot wire has a higher resistivity. 2. Check the B field waveform. The first figure shows the waveform of the B field. A sampling coil (the driver coil used earlier repurposed) measures the signal from the driving coil; this signal is digitally sampled, recorded, and read into Python. This signal is proportional to the time derivative of the B field, and so it is integrated to make the signal that has been plotted. This is obviously not a perfect sine wave, probably as a result of effects from the core of the driving coil. The effect of this distortion can be included in the analysis.l  3. Now measure the signal from the string coil with the new driver coil about 2 mm from the string. The signal from the audio amp is adjusted so that the driver field is about 400 Gauss, measured against the core. (This does not measure the component along the string that excited it, but at least it is proportional to it and provides a reasonable way to character the filed strength.) 4. Process the signal from string coil. This is similar to the processing used to check the waveform fro the driver coil. However, there is an additional step after the integration, and its purpose is to find the hysteresis loop. Thus in the rest of this post we plot and discuss the sampled time derivative of the B field, the integral of this (proportional to the B Field,) and the derived hysteresis loop, presented in arbitrary units. An actual calibration could be done, but for now, the shape of the loop is the issue. The next figure shows the signal measured by the string coil. It is not even close to a sine wave, suggesting that the field from the driving coil (about 400 Gauss at the peaks of the sine wave) moves the state of the string well into the saturation region. After that we see its integral, a signal proportional to the B Field, and thus the string magnetization. This is closer to a square wave than a sine wave, and thus also suggests saturation.   To make the hysteresis loop we use the the measured integrated B as H (x axis). Thus the effect of the distortion due to the driver coil core is included. The final figure shows the result. As expected, it shows that the driver field continues to increase after the increase in the B field drops sharply.  |
|
|
|
Post by ms on May 6, 2022 7:13:39 GMT -5
Adding flux from an auxiliary magnet will break the symmetry of the magnetisation cycle within the string so the results will depend on the local recoil permeability of the string at the various magnetisations produced by the magnet. I am sure that there would be a flattening of the measured peak but it wouldn't really represent the true flux density. Surely the best result would come from simply increasing the magnitude of the alternating flux. Getting enough Ampere-turns shouldn't be a problem but the ferrite core would probably have to be replaced by something with a higher saturation flux density. Losses in the core probably wouldn't matter as long as a reasonably sinusoidal flux could be produced. Mechanical vibration of the string might need to be suppressed. I agree that the measurements that I propose do not give Zollner's results directly. Yes, the measurements, when using a small enough drive signal (the measurement sensitivity is very high with proper processing) give the permeability along some B-H curve. I think that you do a lot with that. I would also like to try higher drive levels with no biasing field. The first step is a bobbin that can stand higher temperatures, since PLA is useless for this. As usual, the limit is heat! It might not be possible to get a field as strong as the usual permanent magnet, and I would like to exhaust what I can do with the current coil before trying. |
|
|
|
Post by ms on May 5, 2022 18:05:58 GMT -5
Thanks for doing this experiment. This in interesting info. Do you think that if the string saturates magnetically, that the height of the curve in your plot would be lower? Do you think this aperture profile, especially if saturation were to cause more homogony along the length, can cause comb filtering effects? Thank you for commenting. Yes, I think that saturation, or even well short of actual saturation, would tend to flatten the peak of the plot, making it look more like Zollner's result. The idea is to put a small permanent magnet of known strength near the string (above it, at a set of measured distances) and check this for various sampled distances along the string. That is, make a set of measurements like the one in the plot, but with the permanent magnet having moved the magnetic state of the string part way along a hysteresis curve, approaching or reaching saturation at the closest distances. |
|
|
|
Post by ms on May 5, 2022 17:35:33 GMT -5
A good result. Instead of modulating the magnetic field (link) you have replaced it entirely with an alternating field. On reflection, the response from modulating the field involves the recoil permeability of both the magnet and the string so the approach you have adopted, by exercising more of the hysteresis loop may well give closer to the true answer. Combining these results with a carefully executed measurement of the response to a moving dipole on the string path would give the pole window shape. Thanks, this was the simplest measurement that I could think of that would give some useful information. I think the next step is to look at how much the output decreases when a magnet is brought close. It appears that this information is needed in the determination the window shape. |
|
|
|
Post by ms on May 4, 2022 14:44:51 GMT -5
Her is a photo of the measurement setup.
 |
|
|
|
Post by ms on May 4, 2022 10:12:50 GMT -5
The plot shows the axial magnetic flux density in a plain G string from a 10s set of NYXL strings in one direction measured along the string from the center of the magnet that magnetizes the string. This is similar to a measurement Zollner performs. His relevant chapter section from Physics of the Electric Guitar is viewed here (I have not looked in his new book yet to see if he has more.): relevant subsection of Zollner's first book
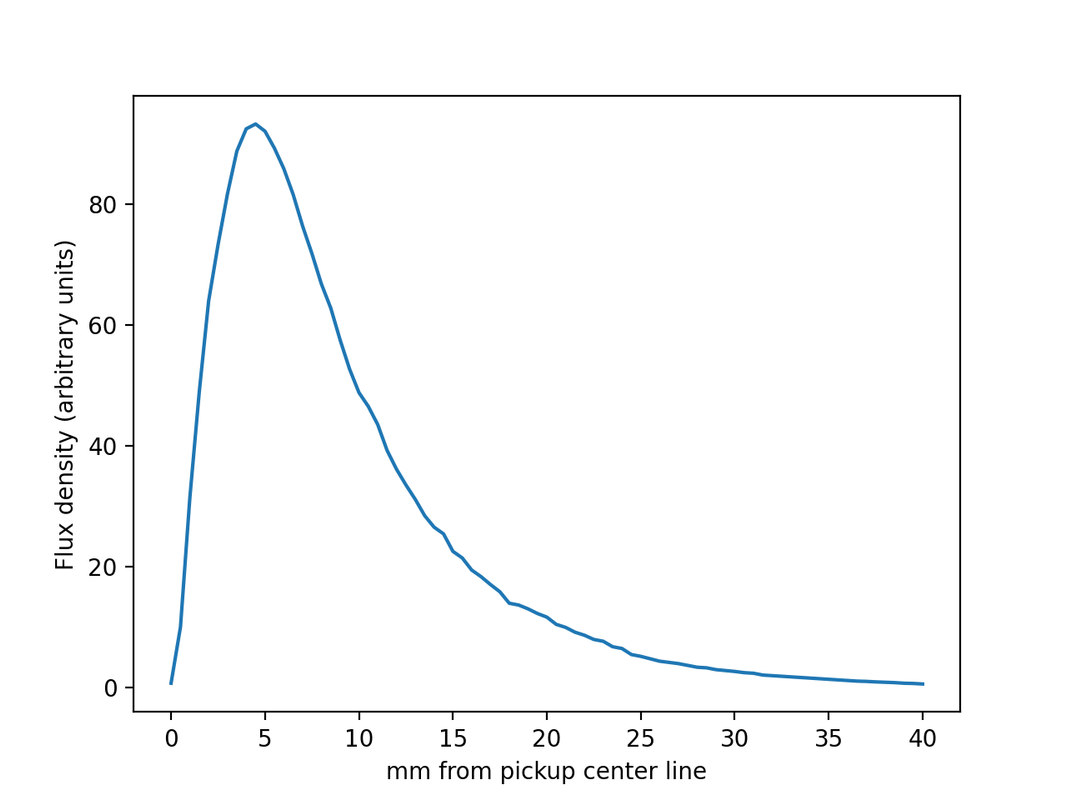 This measurement is different from Zollner’s in several important ways. First, Zollner’s measurement is an amazing accomplishment, one that I would have great difficulty duplicating. My measurement is easy; it uses an electromagnet (250 turns #41 AWG around a ferrite core as used in my strat blade pickups to make a field very similar in shape to that of the permanent field from a blade pickup. It is driven with ac (4 KHz, about 8.6 volts peak) rather than dc. This driving field establishes a time varying flux along the string that is sensed with a small coil (10 turns #42 AWG) around the string. The coil is stationary during a measurement (unlike Zollner’s moving coil), but is moved to a number of different locations along the string with a measurement at each. The signal is about one mv max, and is measured by scope, fft analyzer, and a cross spectrum with the driving signal. The signal to noise ratio is very good. The noise on the plot is a result of errors in locating the sensing coil. The field is about 50 Gauss at the top of the driver, and so it is much weaker than the field from an Alnico rod. Thus, the results are not much affected by the hysteresis of the high carbon string material and show what happens in a simple case. By comparison Zollner’s results appear “squashed”, probably the result of the magnetization approaching saturation. This measurement method can be used to study string saturation. A strong permanent magnet placed close to the string moves the string magnetic state along a hysteresis curve. The permeability decreases, and so the measurement signal level decreases. This effect is easily measurable, but I haver not yet made detailed quantitative measurements to find the degree of saturation as a function of magnetic field strength. The measurement setup uses a guitar, and the neck pickup is replaced with electromagnet. I will post a photo later. |
|
|
|
Post by ms on Apr 13, 2022 15:31:46 GMT -5
The real problem with the skepticism is how little people are skeptical of their own biases, despite mountains of evidence that such bias is at play, and the skepticism against principles of physics, despite the mountain of evidence that physical models accurately describe the world we live in. When it comes to life or death matters of health, people seem quick to "trust the science", but when it's a matter of entertainment, like guitar and music, then the cold and lonely truth seems to take a back seat to imagination. I think the last two years have shown that lots of people do not trust the science on health, even when life and death are involved. But I think you are right, the number trusting it on making music is certainly less. |
|
|
|
Post by ms on Apr 13, 2022 14:53:09 GMT -5
A second look Taking a second look at this problem, I came up with the following modified version:  It is clear from further consideration of the geometry of the pickup that most of the sensing loop area is not coupled to the output at all. In fact, the output coil senses only the current passing through a small part of the common connection.
How did you arrive at this conclusion? I think it is clear that there is a loss of some of the sensing area, but I do not see how to decide how much. The primary loop passes through the core, a closed path of high permeability. Flux from the strings drives current around the primary loop which then creates flux in the core. The exact path through the core should not be all that critical since it is closed and high permeability. I am probably missing something; do you know what it is? |
|
|
|
Post by ms on Apr 12, 2022 7:25:02 GMT -5
I thought it would be worth adding here for reference a useful result for the equivalent impedance of an inductor mutually coupled to another inductor with a resistor load. This is the basis of the impedance ratio of a transformer when K and L are large and also the coupling of losses from eddy currents.
ω0 = R2/L2   ω = 2*π*frequency

U(ω) = k^2 ω^2 / (ω^2 + ω0^2) frequency dependent curve = 1/2 when ω == ω0

L = L1 ( 1 - U(ω) )

R = R1 + U(ω)* R2 * L1 / L2
An alternative analysis (for example, page 213 of Jon Hagen's Radio Frequency Electronics) would avoid the variable frequency inductance. The equivalent circuit consists of an ideal transformer with turns ratio equal to the square root of L1/((k^2)*L2). A magnetizing inductance with value L1 is across the primary. A leakage inductance with value L2(1 - k^2) is in series with the secondary. I believe that this model agrees with yours for the low frequency response. It also makes it easy to see how poor coupling increases the inductance looking back into the secondary and thus lowers the resonant frequency of the system with load, causing the loss of high frequencies. |
|
|
|
Post by ms on Apr 11, 2022 19:53:08 GMT -5
That's really impressive, I'm surprised to see such a high degree of matching just with such a simple model. I'm still trying to understand what's happening, I'll put this into LTSpice and see how different values affect the curve. I think I had trouble figuring out what the inductance was for the Alumitone, the LCR meter couldn't figure it out, probably because of these complicating factors, so I'm wondering if the inductance can be inferred based on this model, although 40 Henries is quite a lot. 40 H is not what sets the resonant frequency. That mostly disappears because of the coupling of the transformer, which in a sense puts a lower impedance across it. If I remember how transformers work, if it had perfect coupling the secondary inductance would not matter at all. |
|
|
|
Post by ms on Apr 11, 2022 17:57:32 GMT -5
If I remember my transformer stuff, coupling below unity should put an inductor in series with a winding of a unity coupled transformer; you can put it in series with either the primary, the secondary (different value, of course), or split it, I suppose. So I am thinking that varying the coupling should be the same as varying the value of one of the inductors in the circuit. Is this what you see, or do I have it all wrong?
|
|
|
|
Post by ms on Apr 6, 2022 15:37:49 GMT -5
Using the uniformly space magnet distribution described above, the output of the plain (not wound) G string is a bit high. (This is true for many pickups that do not have away of removing this effect. I do not consider this a big problem, but why not fix it if possible?) The magnet distribution is uniform on the ferrite core. The solution is alter this magnet distribution as shown below. The small disk magnet has a diameter of 0.1 inches and a thickness of 1/32 inches. The small disk is not centered perfectly under the G striung, but this is an adequate solution. The field over the location of the G string is about 40 percent less than the average of the two adjacent strings. These measurements are approximate, of course.  |
|
|
|
Post by ms on Apr 5, 2022 10:33:36 GMT -5
Yes, my mistake. With the guitar cable in the circuit, the resonance is low enough in frequency so that the most important loss is from the parallel combination of the volume and tone pots. (With the tone pot on 10, the capacitor can be modeled as a short circuit near the resonant frequency.) Eddy current losses increase with about the square root of frequency, so there is a frequency where they become dominant, but that frequency is higher than we are concerned with.
|
|
|
|
Post by ms on Apr 4, 2022 12:53:56 GMT -5
When you decrease the resistance while keeping the inductance the same you make the Q of the circuit higher: that is, the resonant peak becomes a bit narrower and higher. Your pickup is a humbucker, presumably with steel cores. In this case most of the loss (that is, current in resistances) in the pickup electrical circuit might be from eddy currents in the steel. Then a slight change in the DCR of the coil might not make enough difference to hear because its contribution to the total loss is relatively small.
|
|
|
|
Post by ms on Apr 2, 2022 6:51:23 GMT -5
This is primarily about the electrical circuit the pickup is connected to, and so the description of the pickup parameters is approximate. One thing that might cause confusion: the pickup inductance is not proportional to the permeability of the cores. This would be a good approximation only if the core was closed, like a toroid; then it would not be a pickup! Actually, even if the relative permeability is thousands, the coil inductance with the core is only maybe a few times more than the equivalent air core coil.
|
|
|
|
Post by ms on Mar 1, 2022 14:27:30 GMT -5
There is much more in that patent than I remembered. I think claim 5 actually refers to the sidewinder pickup described in figures 11-13, which has end plates that tend to complete the circuit, except that part of the circuit is low permeability permanent magnets, and so I think this actually does not work as well as he describes it. But again, maybe I misunderstand.
This is after he describes the pickup where each coil is for three of the strings, that is, like the split precision bass pickup from 1957 and on. Since this patent was filed in 1955, I wonder if Lover should be considered the inventor of the precision bass split pickup? Did Leo Fender know about this patent application?
|
|
|
|
Post by ms on Mar 1, 2022 11:43:50 GMT -5
I think that idea would work well. The filter would use ffts, although I would probably use a cross spectral technique rather than a simple power spectrum. Oh yeah, a great hum detector if you increase the permeability of the material connecting the two coils. I tried that some years ago in hardware without thinking it through first! Seth Lover's patent, U.S. Patent 2,896,491 ( patentimages.storage.googleapis.com/db/ac/09/ef18558290da83/US2896491.pdf), claim five, seems to imply that the magnet helps complete the flux path and makes the pickup work better. If it really did that to any significant degree, the pickup would hum badly! Maybe I am misreading that claim. |
|
|
|
Post by ms on Mar 1, 2022 7:11:01 GMT -5
Thanks, I understand this better now. This tool complements the hardware tool I have for measuring sensitivity to a spatially nearly constant field: a sawed off 5 gallon paint bucket with two coils wrapped around it I have not used it in quite a while since it is not very convenient.
|
|


